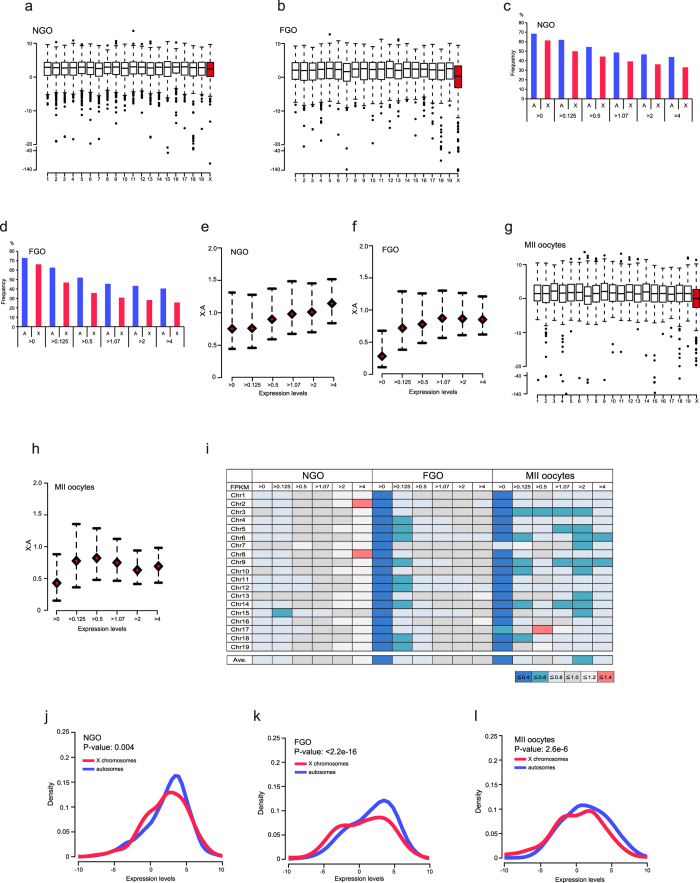
Figure 2. Expression ratios of X:A were lower in mature mouse oocyte compared with immature mouse oocyte.
(a,b) Box plots of expression of genes with >0 FPKM in NGO (a) and FGO (b). (c,d) Expression frequencies of X-chromosome and autosomal genes in NGO (c) and FGO (d) based on the expression FPKM expression levels. The expression frequencies of X-chromosome and autosomal genes were significantly different for all expression categories (P < 0.01, Fisher’s exact test). (e,f) X:A expression ratios (all autosomes) by bootstrap analysis in NGO (e) and FGO (f). The red rhombus indicates the median. Error bars show 95% bootstrap confidence intervals. (g) Box plots of expression of genes with >0 FPKM in MII oocytes. (h) X:A expression ratio (all autosomes) by bootstrap analysis in MII oocytes. (i) X:A median expression ratio (each chromosome) of each FPKM category. Ave. means the average of each ratio according to the median expression levels. (j–l) Density plots of X-linked and autosomal genes with >0 FPKM in NGO (j), FGO (k), and MII oocytes (l). Expression levels are shown as log2 values. Distribution similarities between X-chromosome and autosomal genes were determined by the Kolmogorov-Smirnov test. The P-value was calculated by the Kolmogorov-Smirnov test.

