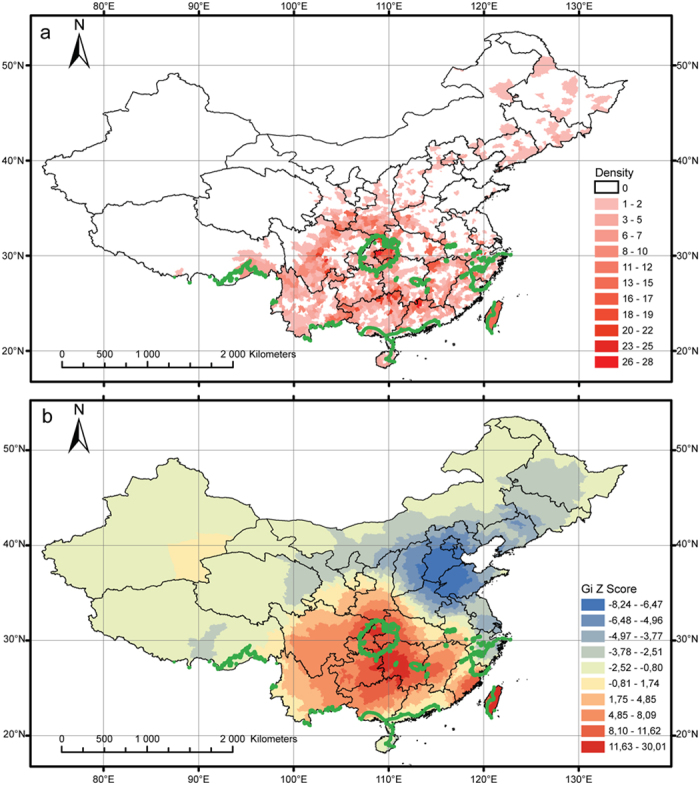
Figure 3. Distribution of relict genera in China, with the green line representing regions where both autumn and spring precipitations are over 300 mm:

(a) number of relict genera per county, (b) results of the hotspot analysis, with red colours indicating hotspot regions and blue colours indicating cold-spot regions. Maps were generated using the software ArcGIS 9.3.
