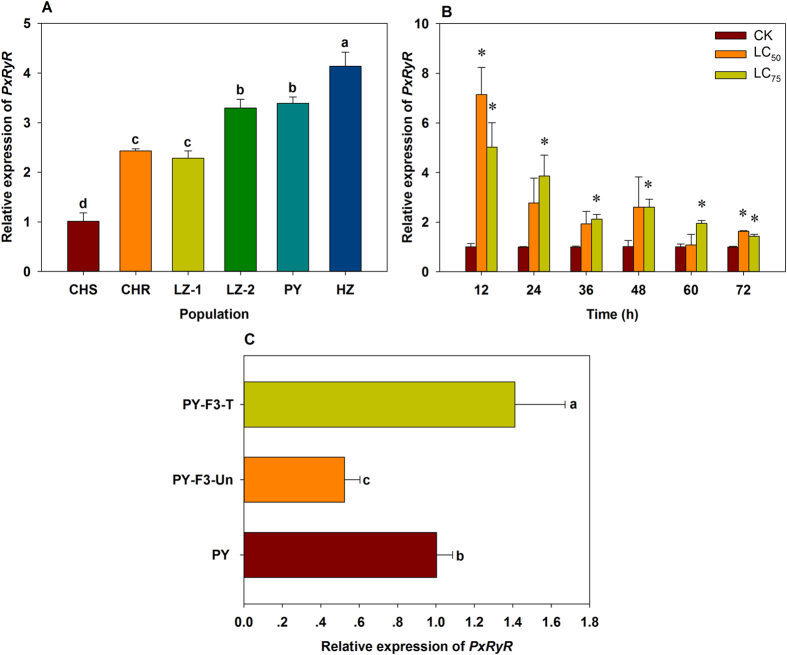
Figure 1. Relative expression of PxRyR in Plutella xylostella.
(A) PxRyR expression in five resistant populations and a susceptible one. The relative expression of PxRyR in other five resistant populations was normalized to that in CHS population. (B) PxRyR expression in CHS population after treatment with LC50 or LC75 of chlorantraniliprole for different times. (C) PxRyR expression in different groups of PY population. Data presented as the mean ± SD for three independent replicates. The bars with different small letters in (A) and (C) are significantly different according to the one-way ANOVA, followed by Tukey’s multiple comparison test (P < 0.05), and the asterisks* in (B) represent the significant difference between the treatment and corresponding untreated control (Student’s t-test, P < 0.05).

