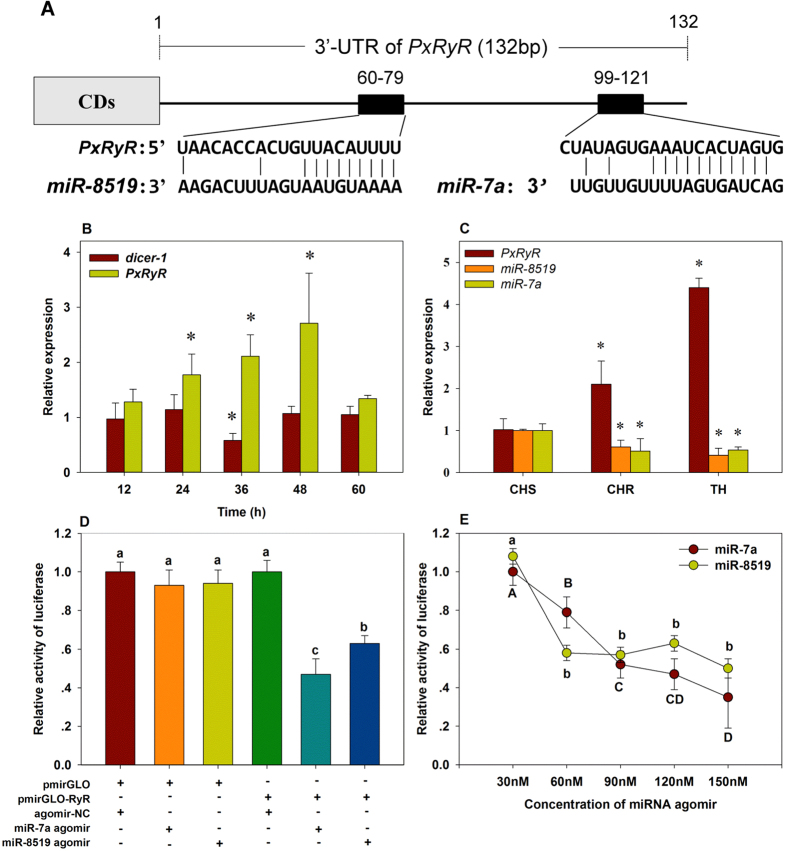
Figure 3.
(A) Predicted target sites of miR-7a and miR-8519 in the 3′-UTR of PxRyR. (B) Relative expression of PxRyR after knockdown of dicer-1. (C) Relative expression of miR-7a, miR-8519 and PxRyR in CHS, CHR and TH populations. (D) Luciferase reporter assays performed by co-transfection of miR-7a or miR-8519 mimics with a luciferase reporter gene linked to the 3′-UTR of PxRyR. (E) Relative activity of firefly luciferase negatively co-related with the concentration of transfected miRNA mimics. All data are presented as the mean ± SD of three independent replicates. The bars marked with an asterisk * in (B,C) are significantly different (Student’s t-test, P < 0.05) with their corresponding control. In both (D,E), the firefly luciferase activity was normalized to Renilla luciferase activity and then normalized to the activity of the control group. Bars in (D) with different letters are statistically different, and in (E), small letters stand for significant difference for miR-8519, and the capital ones for miR-7a. (One-way ANOVA followed by Tukey’s multiple comparison tests, P < 0.05).

