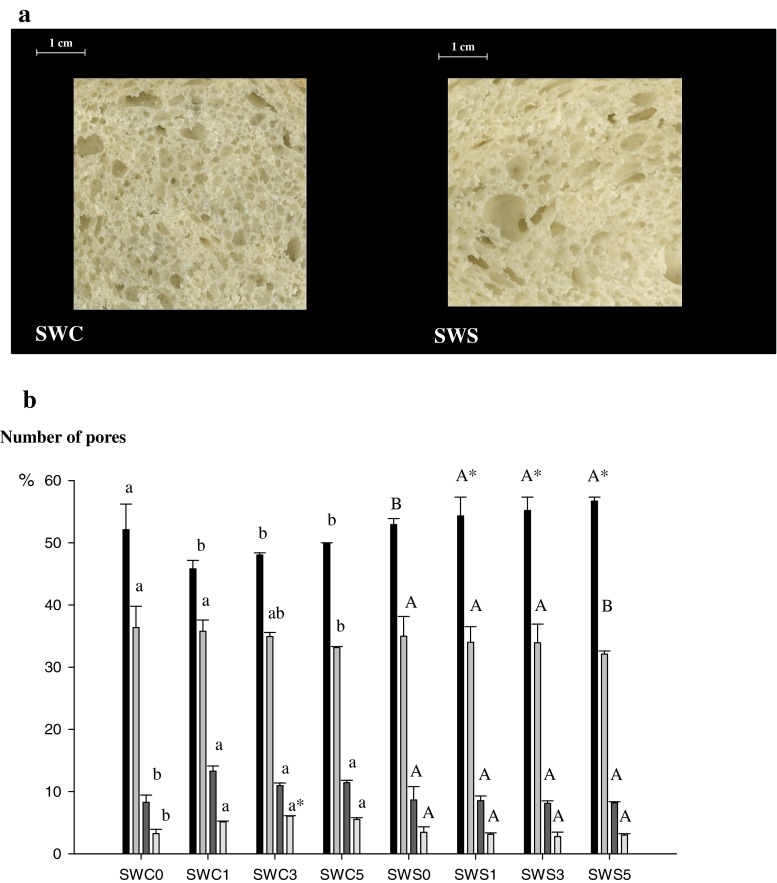
Fig. 3.
Images of the central slice of loaf at time 0 (panel a) and number of pores as percentage of the total number of pores for the selected dimensional classes at different storage times (panel b) for soft wheat breads. Error bars represent +/− 1 standard deviation, (n = 3, sample size = 3 for each bread type). Bars of histograms with the same lowercase and capital letters are not significantly different (p < 0.05). Bars with single (p < 0.05) or double (p < 0.01) asterisks differed significantly between the two types of bread at the same storage time. SWCn soft wheat compressed yeast bread at each storage time; SWSn, soft wheat sourdough bread at each storage time

