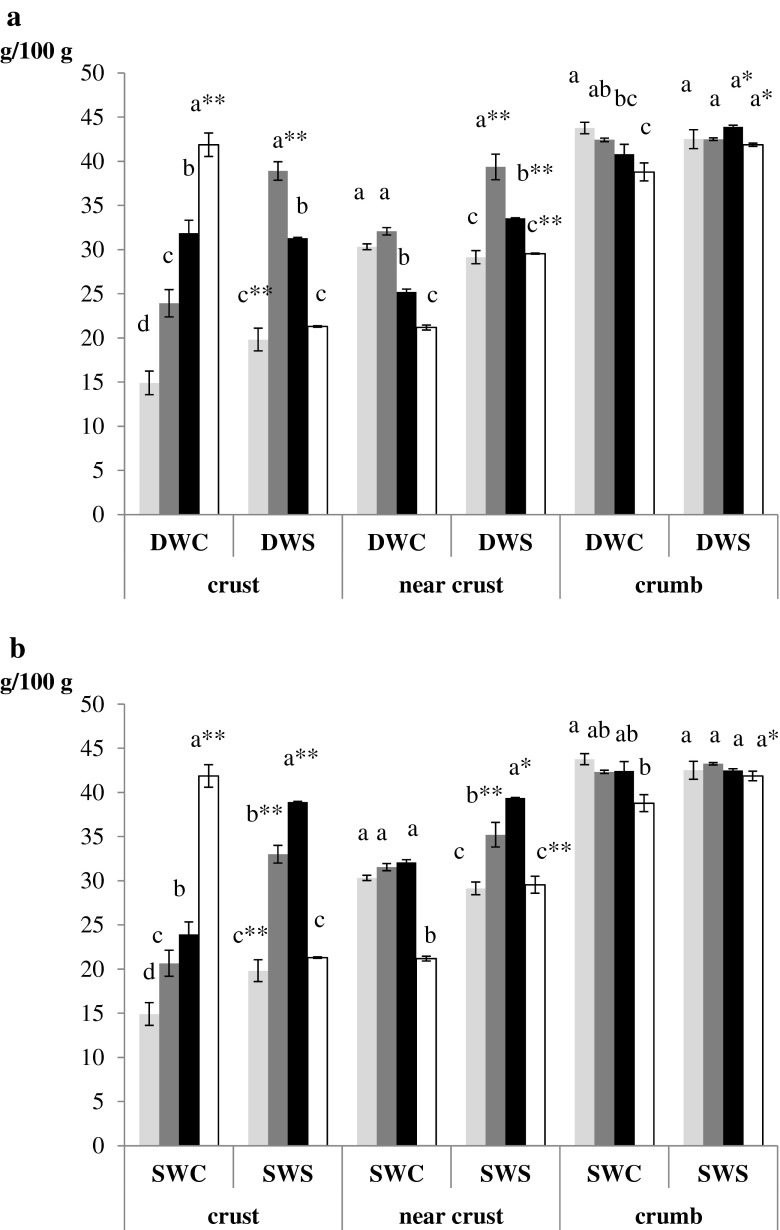
Fig. 4.
Moisture content at crust, near crust and crumb for durum wheat flour bread (panel a) and soft wheat bread (panel b) at day 0 (light grey histogram), day 1 (dark grey histogram), day 3 (black histogram) and day 5 (white histogram). Error bars represent +/− 1 standard deviation, (n = 3, sample size = 3 for each bread type). Bars of histograms with the same lowercase and capital letters are not significantly different (p < 0.05) Bars with single (p < 0.05) or double (p < 0.01) asterisks differed significantly between the two types of bread at the same storage time

