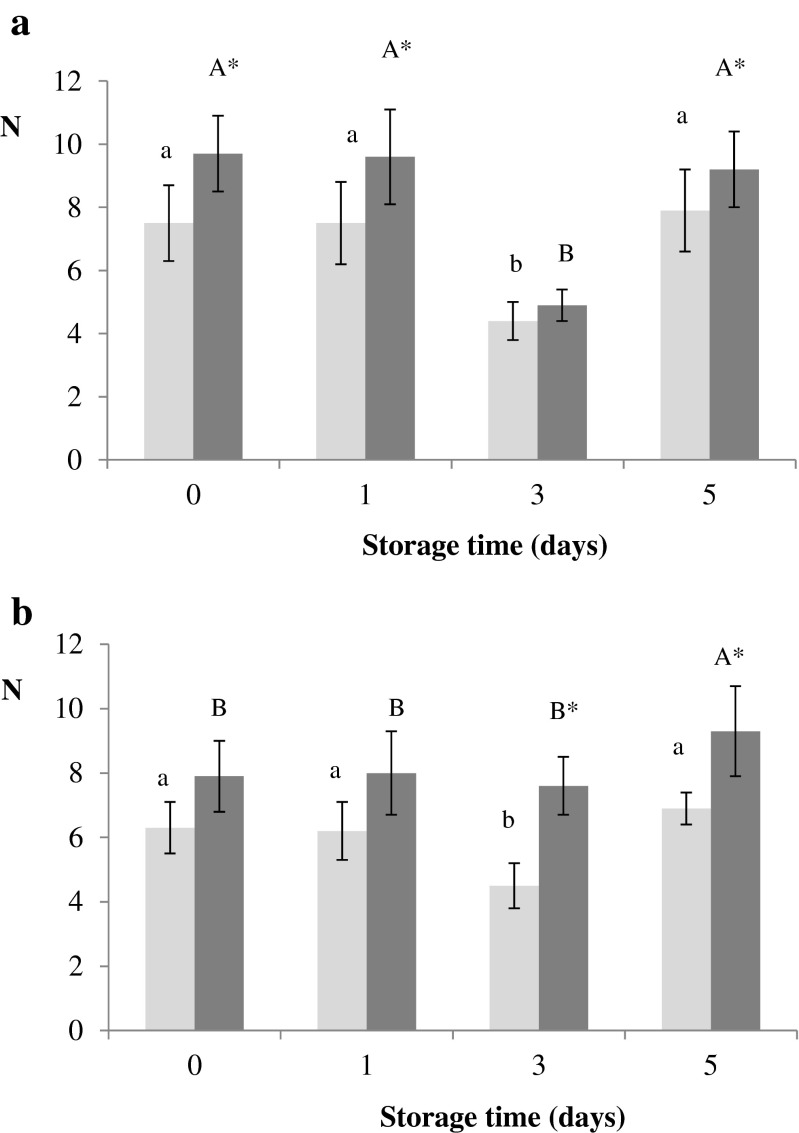
Fig. 5.
Crust hardness of durum (panel a, DWC light grey and DWS dark grey histograms) and soft wheat (panel b, SWC light grey and SWS dark grey histograms) breads at different time of storage. Error bars represent +/− 1 standard deviation, (n = 3, sample size = 5 for each bread type). Bars of histograms with the same lowercase and capital letters are not significantly different (p < 0.05). Bars with single (p < 0.05) asterisk differed significantly between the two types of bread at the same storage time

