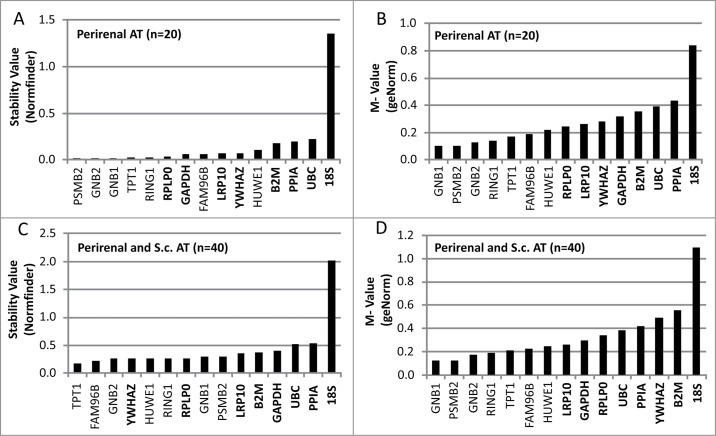
Figure 1.
Evaluation of stability- and M-values for reference genes in adipose tissue (AT) using qPCR. The evaluation was performed in 2 sets of adipose tissue samples. The first set (A and B) included 20 samples of perirenal AT with half of them containing variable levels of brown adipocytes. The second set (C and D) included the previously analyzed preirenal AT samples as well as 20 s.c. AT samples from both lean and obese subjects. qPCR results from both sets of samples were analyzed using 2 different algorithms; the normfinder algorithm (A and C) and the geNorm algorithm (B and D). Gene symbols in bold text are classified as commonly used reference genes.

