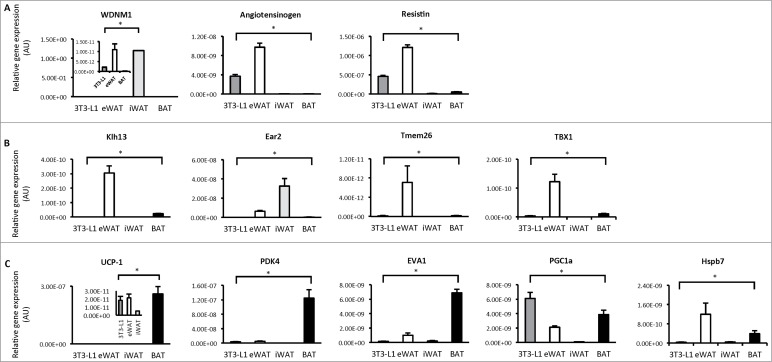
Figure 2.
Gene expression profiling in 3T3-L1 adipocytes, white and brown adipose tissue. (A) Expression of genes that distinguish white adipocytes in 3T3-L1 adipocytes, epididymal white adipose tissue (eWAT), inguinal white adipose tissue (iWAT) and brown adipose tissue (BAT; subscapular brown fat). (B) Expression of genes that distinguish beige adipocytes in 3T3-L1 adipocytes, WAT and BAT. (C) Expression of genes that distinguish brown adipocytes in 3T3-L1 adipocytes, WAT and BAT. Data are represented as mean ± SEM, n = 6 biological replicates/individual mouse samples per group. * Denotes significantly different from all other groups.

