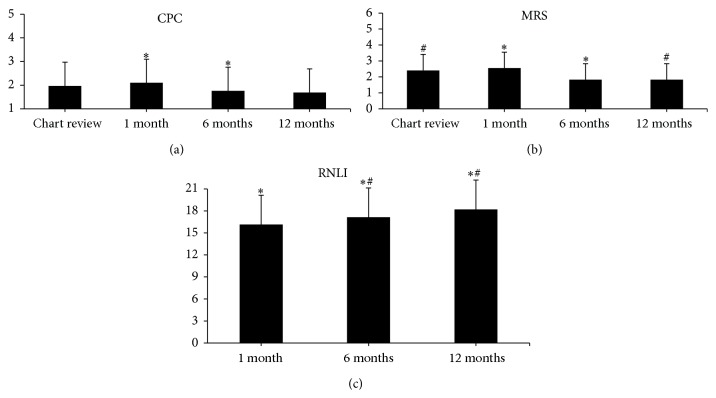
Figure 1.
Bar graphs for longitudinal data. (a) demonstrates the longitudinal CPC data. (b) illustrates the longitudinal mRS data. (c) illustrates the longitudinal RNLI data. CPC: Cerebral Performance Category. mRS: Modified Rankin Scale, CPC: Cerebral Performance Category, and RNLI: Reintegration to Normal Living Index. ∗ P < 0.05 between time points; # P < 0.05 between time points.

