
Figure 3.
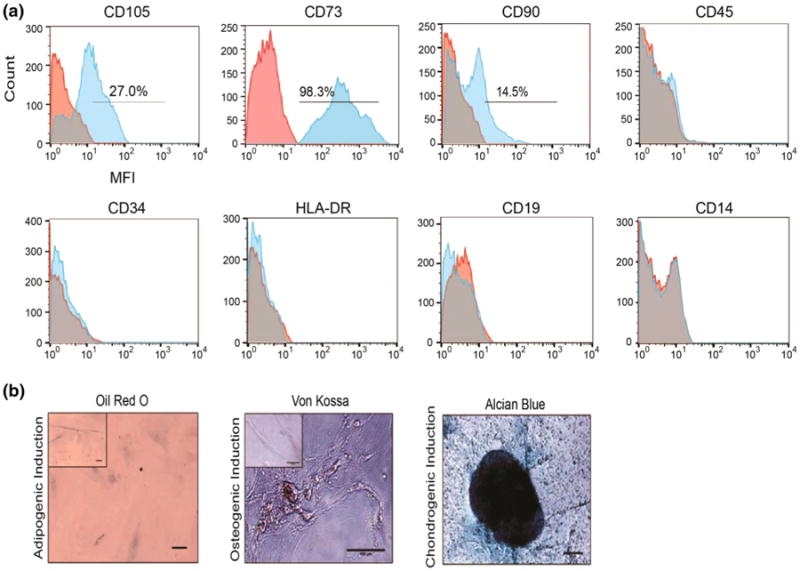
Evaluation of SS-MNCs for mesenchymal stem cell phenotype and function. (a) Representative histograms depicting SS-MNC surface marker expression though median fluorescence intensity (MFI) for CD105, CD73, CD90, CD45, CD34, HLA-DR, CD19, CD14 in comparison to mouse IgG isotype control. (b) Representative images of SS-MNCs after culture with induction media towards adipogenic, osteogenic, or chondrogenic lineage and staining with Oil Red O, von Kossa, or Alcian blue, respectively. Insets represent control conditions. Scale bar equals 100 μm.