
Fig. 1.
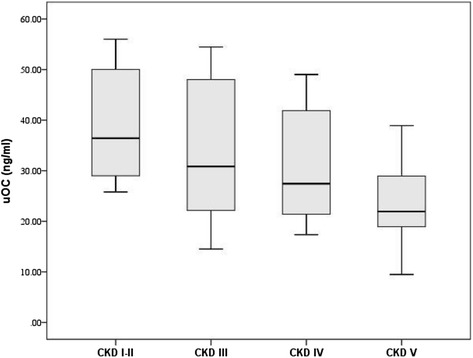
Relationship between uOC concentration and progression of CKD. uOC concentration decreased significantly with the progression of CKD (P < 0.01). This figure is a “box and whisker plot”. The center (box) represents the middle 50th percentile of the data set and is derived using the lower and upper quartile values. The median value (dark line) is displayed inside the box. The maximum and minimum values are displayed with vertical lines (whiskers) connecting the points to the center box