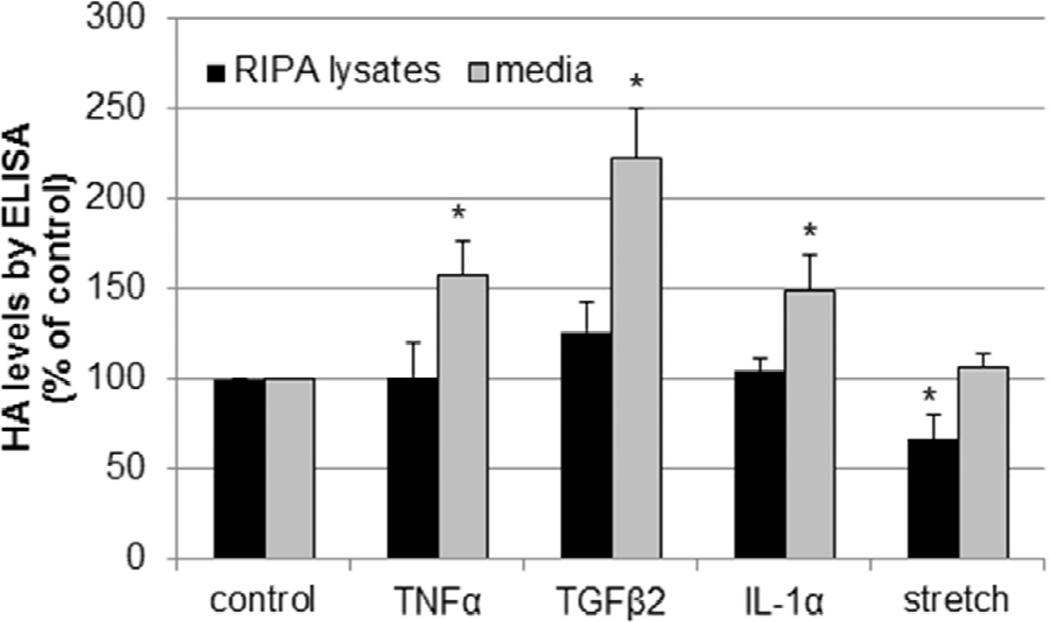
Figure 3. Measurement of HA concentration by ELISA.
TM cells were treated for 24 hours with TNFα, IL-1α or TGFβ2 or mechanical stretch and the HA levels in serum-free media and RIPA cell extracts was quantitated by a competitive ELISA assay. HA levels in RIPA lysates and media are presented as a percentage of the control. N=6; *, P<0.05 by ANOVA.

