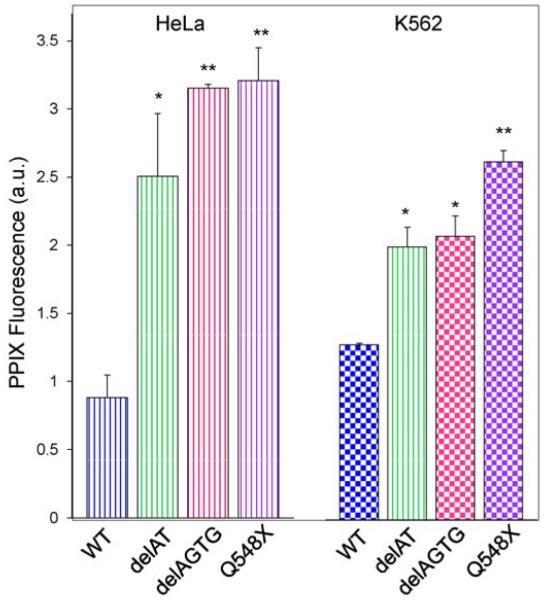
Figure 2.
Expression of XLPP variants in mammalian cells results in accumulation of PPIX. HeLa cells are indicated by vertical-striped bars, while K562 cells are represented by checkered bars. The graph bars correspond to the results with wild-type hALAS2 (blue), delAT (green), delAGTG (pink), and Q548X (purple). Mean PPIX fluorescence values are representative of three separate experiments ± standard deviation (*p<0.05 and **p<0.01, Student’s t-test) [a.u., arbitrary units].

