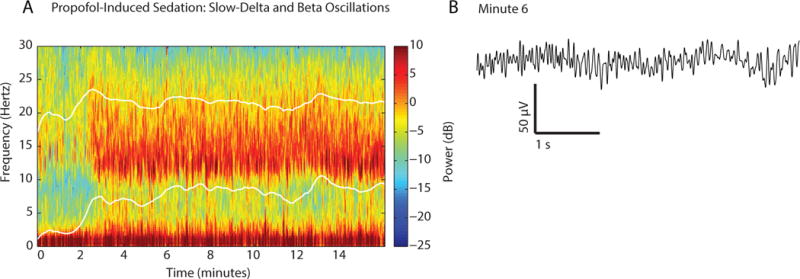
Fig. 5.

Spectrogram and the time-domain signature of propofol-induced sedation. A. Spectrogram shows slow-delta oscillations (0.1 to 4 Hz) and alpha-beta (8 to 22 Hz) oscillations in a volunteer subject receiving a propofol infusion to achieve and maintain a target effect-site concentration of 2 mcg/ml, starting at time zero.20 The subject was responding correctly to the verbal, but not to click train auditory stimuli delivered every 4-seconds for the entire 16 minutes suggesting that she was becoming sedated.20 The lower and upper white curves are the median and the spectral edge frequencies respectively. B. Ten-second electroencephalogram trace recorded at minute 6 of the spectrogram in A.
