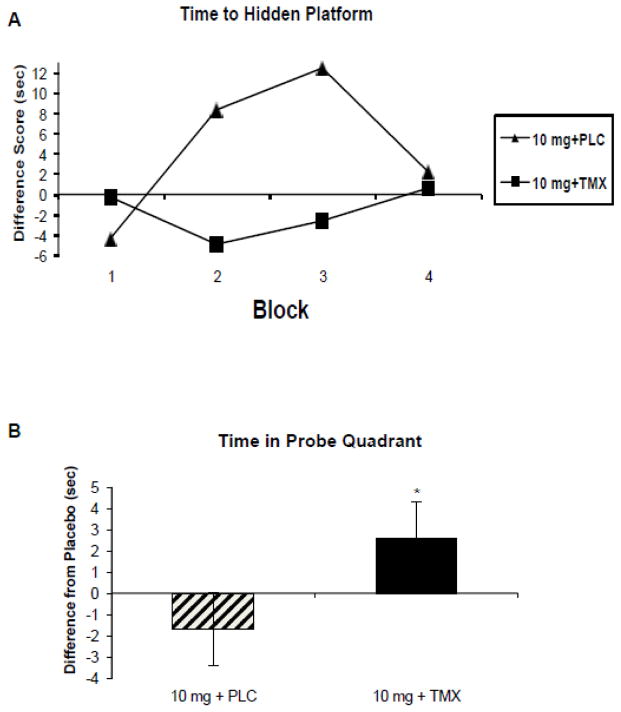
Figure 6. Virtual Morris Water Maze.
(modified from Newhouse et al., 2013):
A. Platform latency during learning trials after mecamylamine 10 mg challenge. Filled triangle represents long-term placebo treatment. Filled squares represent long-term tamoxifen 10 mg treatment. F(1,14) = 6.6, p=.024 for main effect of tamoxifen treatment. B. Time spent in correct quadrant during the probe trial; difference from placebo challenge during mecamylamine challenge (10 mg). Crosshatch bar represents placebo long-term treatment and dark bar represents tamoxifen 10 mg oral long-term treatment. F(1,67) = 6.28, p<.01 for main effect of tamoxifen treatment.

