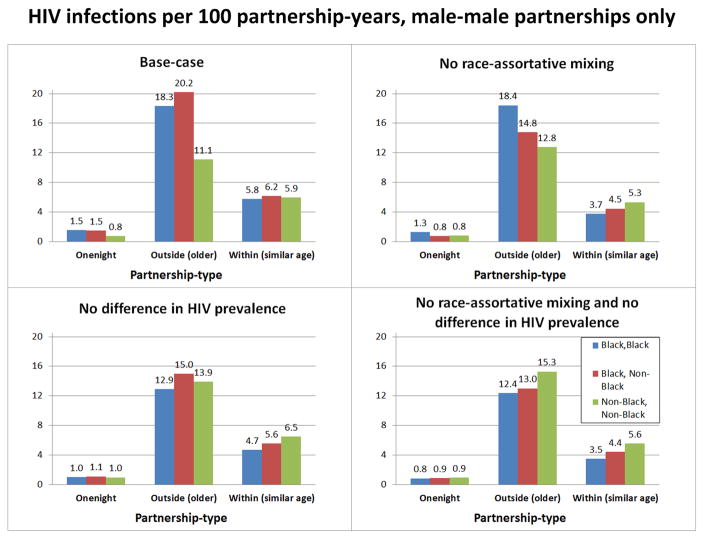
Figure 3.
HIV infections per 100 partnership-years, male-male partnerships only. A) Base-case scenario corresponding to Figures 1 and 2. HIV infections per 100 male-male partnership-years in case of one-night-partnerships denotes HIV infections per average number of one-night-partnerships per year. For within-partnerships the number of partnership-years is the sum of the number of susceptible-infected partnership-years plus two times the number of susceptible-susceptible partnership-years (see online Appendix section 7.2 for details). B) Counterfactual scenario with no race-assortative mixing, i.e. YMSM select partners independent of race. C) Counterfactual scenario with no difference by race in initial HIV prevalence (5.6% at baseline) and among outside partners (set to 17.2%). D) Counterfactuals of Figures B) and Figure C) combined. In case of outside partnerships, i.e. partnerships of YMSM with older MSM, Black-NonBlack partnerships denote both partnerships of Black YMSM with older NonBlack MSM and partnerships of NonBlack YMSM with older Black MSM (see also Figure 27 in online Appendix section SDC 7.2).

