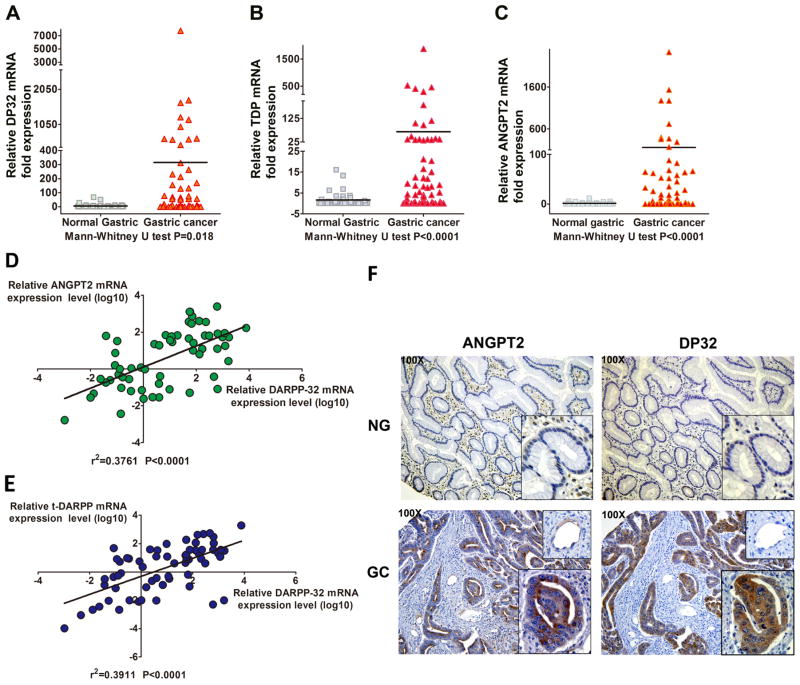
Figure 7. ANGPT2 and DARPP-32 proteins are up-regulated in human gastric cancer tissue samples.
A–C) qRT-PCR analysis of DARPP-32, t-DARPP, and ANGPT2 mRNA expression in normal gastric and gastric cancer tissue samples. Horizontal line indicated mean. Significance was evaluated by Mann-Whitney U test. D–E) Correlation between ANGPT2 and DARPP-32 (r2=0.4, P<0.0001) or t-DARPP and DARPP-32 (r2=0.4, P<0.0001) mRNA levels in gastric cancer tissue samples (relative mRNA expression levels were converted to log10 values, linear regression). F) Immunohistochemical staining of ANGPT2 and DARPP-32 in normal and gastric cancer tissue samples (100X). Glandula and blood vessel tissues in the normal and gastric cancer samples were amplified to show the details of ANGPT2 and DARPP-32 expression.

