Figure 2.
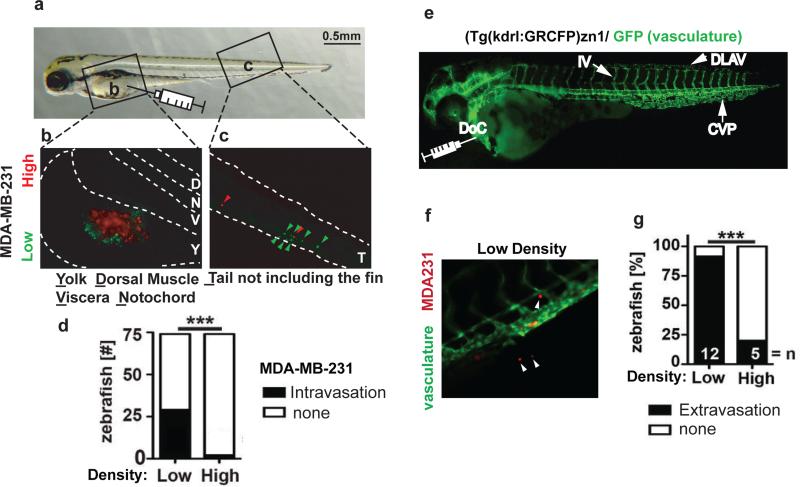
Cell growth density in vitro affects intravasation and extravasation.(a) Representative image of a zebrafish embryo 4 d after fertilization. The boxed areas mark the yolk sac (b) and tail region (c) shown as fluorescent images in panels b & c. The syringe indicates the location of injection of labeled tumor cells into the yolk sac from where the tumor cells intravasate. (b,c) Representative fluorescent images of the yolk sac (b) and tail (c) regions of a zebrafish embryo whose yolk sac was injected simultaneously with MDA-MB-231 cells grown at low or high density and labelled with green or red dyes. Dotted lines mark the boundaries of the yolk sac (b) and the tail region (c). Red arrowheads indicate high density cells and green arrowheads indicate low density cells that invaded the vasculature to reach the tail region. (d) The number of zebrafish embryos with or without detectable intravasated MDA-MB-231 cells in the tail region 2 d after injection. *** p<0.0001. (e) Fluorescent image of a (kdrl:GRCFP)zn1 zebrafish with green fluorescent vasculature 4 d after fertilization. DLAV, Dorsal Longitudinal Anastomotic Vessel; IV, Intersegmental Vessel; CVP, Caudal Vein Plexus; DoC, duct of Cuvier. The syringe points to the site for direct intravascular injection of labeled tumor cells. (f) Representative image of the tail of a (kdrl:GRCFP)zn1 zebrafish after intravascular injection with red-labelled MDA-MB-231 cells. White arrowheads indicate cells extravasated from the green fluorescent vasculature. (g) Percentage of kdrl:GRCFP)zn1 zebrafish embryos containing MDA-MB-231 cells extravasated into neighboring tissues 2 d after intravascular injections. n, number of fish analyzed; *** p<0.0001.

