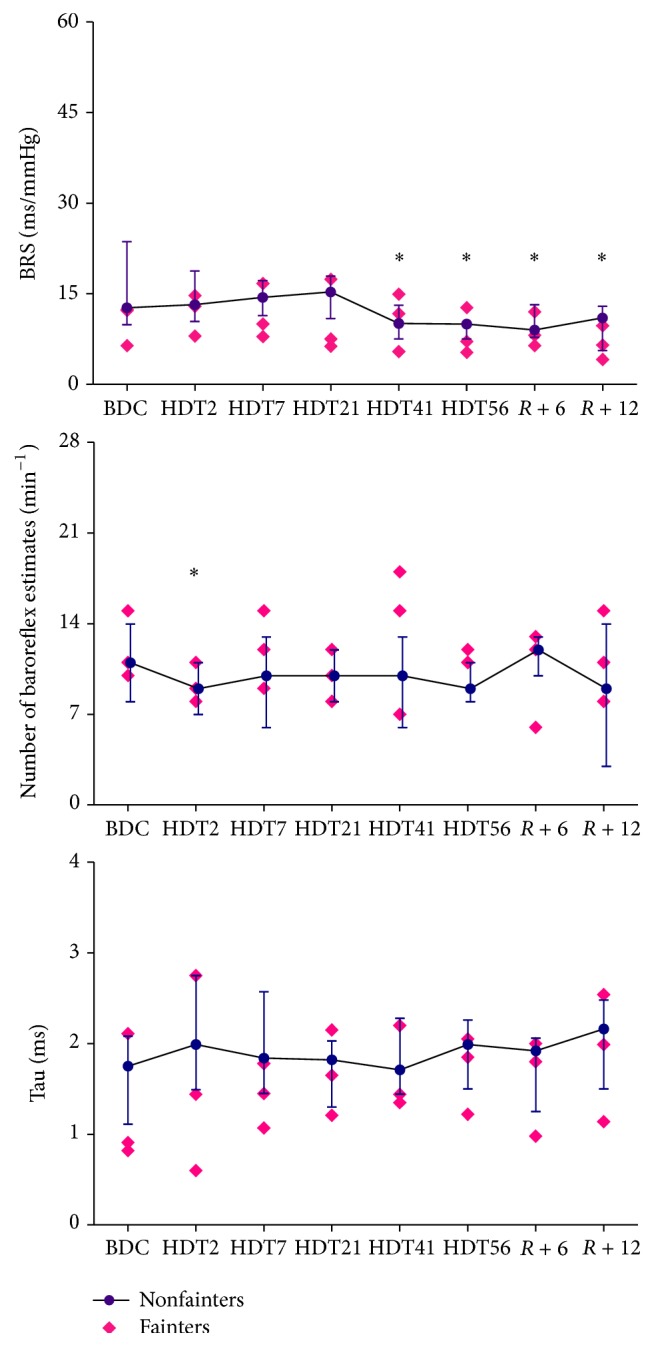
Figure 2.

Changes in baroreflex sensitivity (BRS), number of baroreflex estimates per minute, and tau (optimal time delays) during HDBR in the fainters and the nonfainters. Nonfainters, the median values [25th, 75th percentiles] are shown as dots, n = 11; fainters, the absolute individuals values are shown as diamonds, n = 3; BDC, 14 days before head-down bed rest; HDT2, the 2nd day of bed rest; HDT7, the 7th day of bed rest; HDT21, the 21st day of bed rest; HDT41, the 41st day of bed rest; HDT56, the 56th day of bed rest; R + 6, the 6th day during recovery; R + 12, the 12th day during recovery. ∗ P < 0.05 compared with baseline before HDBR.
