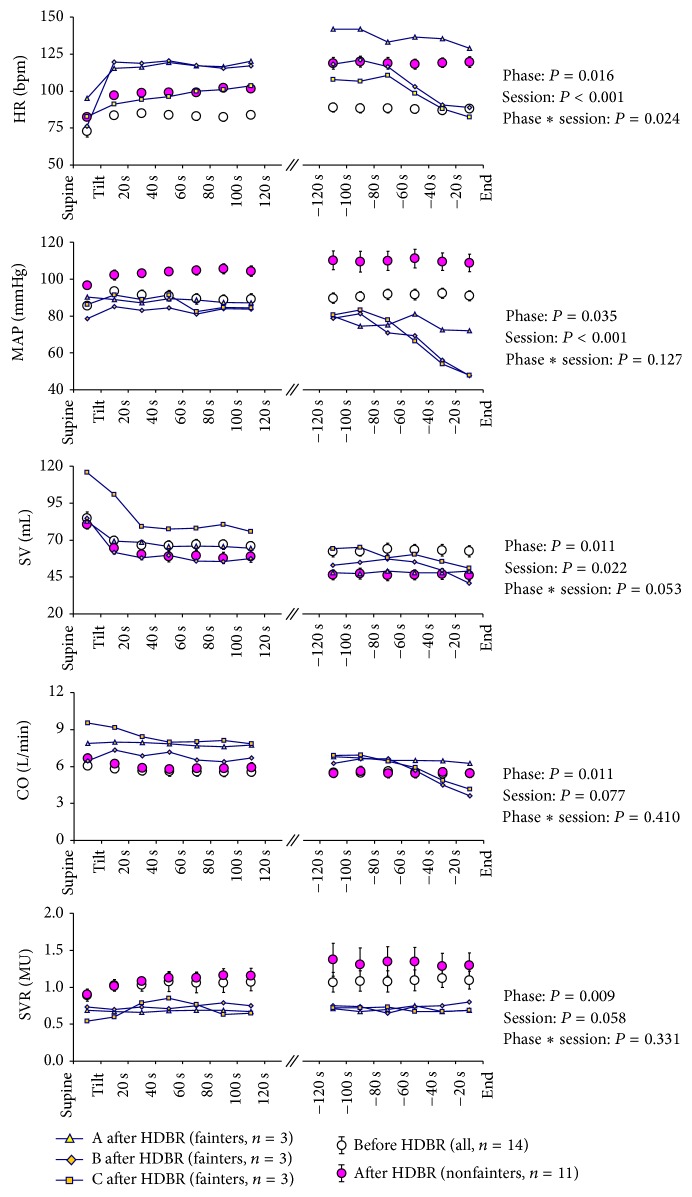
Figure 5.
Changes in estimated heart rate (HR), mean arterial pressure (MAP), stroke volume (SV), cardiac output (CO), and systemic vascular resistance (SVR) from supine until the end of head-up tilt testing. Values in the supine position during the first and last 2 minutes of the tilt are presented as averages at 20-second intervals. In the nonfainters (n = 11), phase indicates the different moment during HUTT, and session includes two parts (pre-HDBR and post-HDBR).

