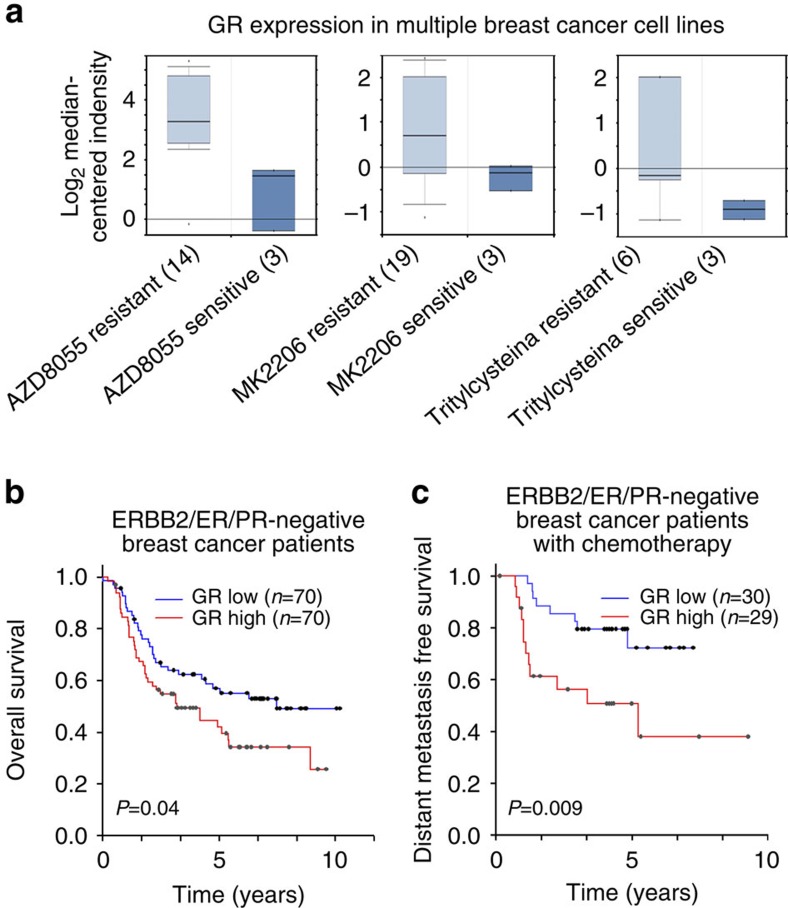
Figure 1. Correlation of GR expression with pharmacotherapy resistance of breast cancer cells and clinical outcomes of breast cancer patients.
(a) Correlation of GR expression with resistance to the mammalian target of rapamycin inhibitor AZD8055, AKT inhibitor MK2206 and mitotic kinesin Eg5 inhibitor S-trityl-L-cysteine in multiple breast cancer cell lines. The numbers in the brackets indicate the numbers of different breast cancer cell lines. The gene expression data are from a previous study12. (b) Kaplan–Meier analysis comparing overall survival of a cohort of TNBC patients distinguished by low versus high expression of the GR gene. The clinical gene expression data are from a previous study14. (c) Kaplan–Meier curves comparing distant metastasis-free survival of another cohort of TNBC patients undergoing chemotherapy distinguished by low versus high expression of the GR gene. The clinical gene expression data are from a previous study15.

