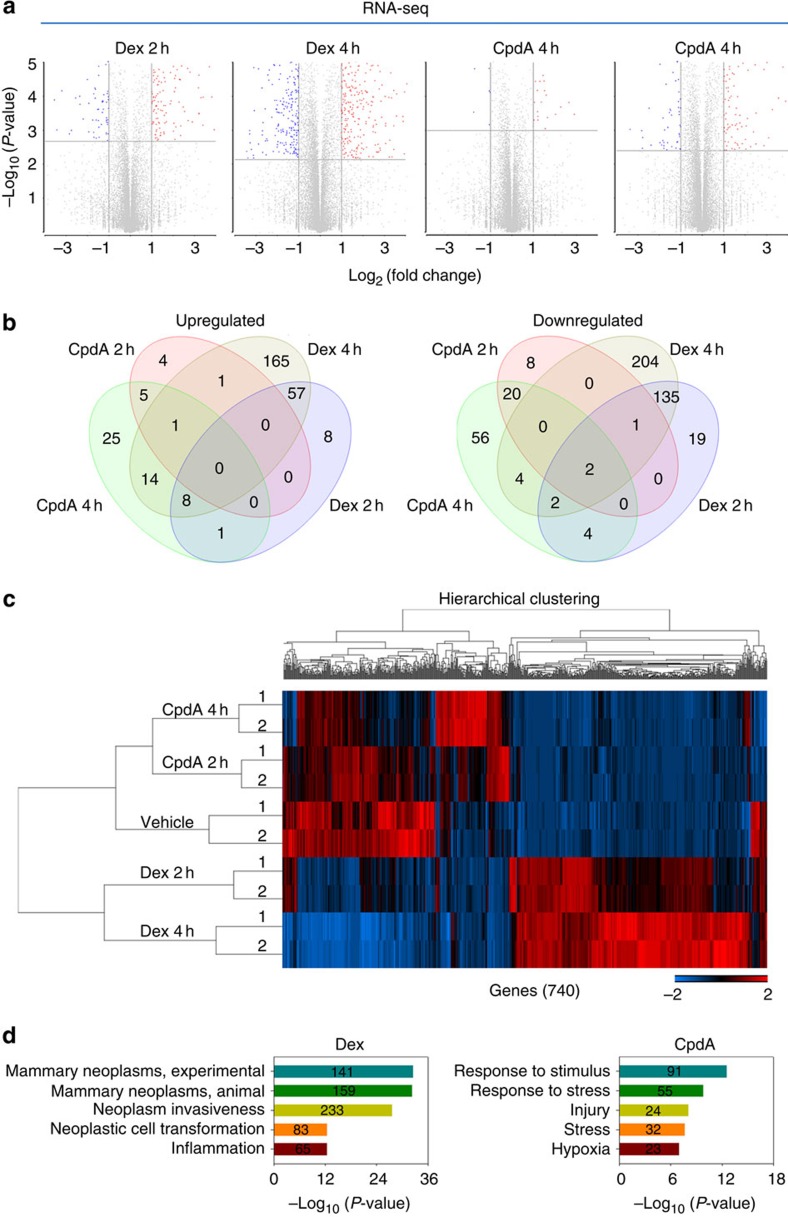
Figure 2. Analysis of Dex- and CpdA-stimulated transcriptomes in MDA-MB-231 cells.
(a) Volcano plots of pairwise gene expression changes in response to 100 nM Dex for 2 and 4 h, or 10 μM CpdA for 2 and 4 h. Significant differentially expressed genes (fold>2) are highlighted in colour (red for upregulated genes and blue for downregulated genes) with FDR<0.05 (horizontal line). (b) Venn diagrams show upregulated (left panel) and downregulated (right panel) genes regulated by 2 and 4 h Dex or CpdA treatment. (c) A heatmap of differentially expressed genes after CpdA or Dex treatment at indicated time points. Genes varied across all samples after treatment with FDR<0.05 were used in hierarchical clustering. The gene expression (reads pe kilobase per million mapped reads (RPKM)) values for each gene were normalized to the standard normal distribution to generate Z-scores. The scale bar is shown with the minimum expression value for each gene in blue and the maximum value in red. (d) Enriched Gene Ontology (GO) terms in Dex- and CpdA-regulated genes.

