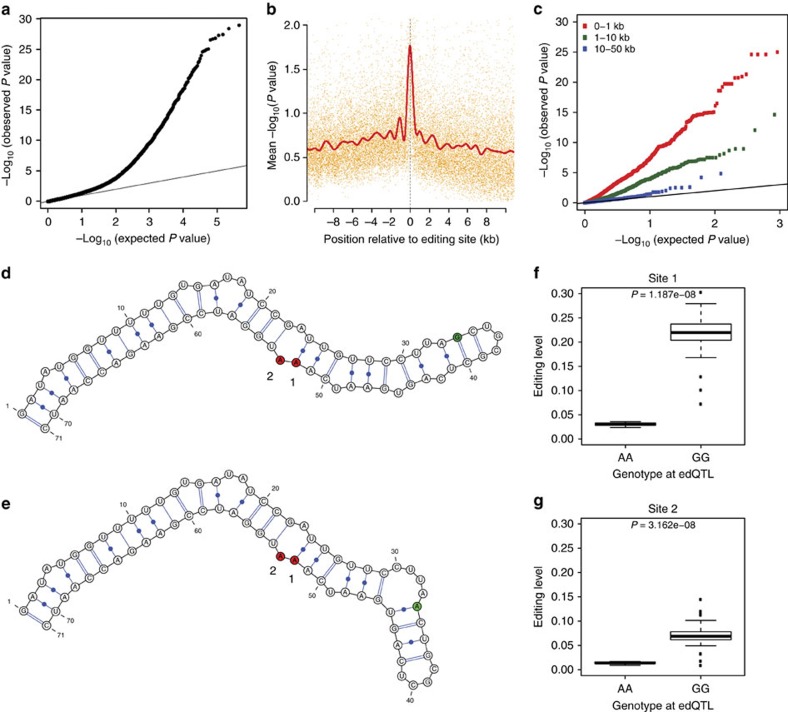
Figure 2. Mapping RNA editing QTLs.
(a) Quantile–quantile (QQ) plot for association testing P values between 789 RNA editing sites and genetic variants in the same gene as each editing site. (b) Significance of association tests in relation to the distance between the editing site and variant. The solid red line is a cubic smoothing spline fit to the data. Transcripts were oriented such that negative and positive values represent variants transcriptionally up- and downstream of the editing site, respectively. (c) QQ plot for association tests between 545 edQTLs and additional editing sites that fell within 1 kb (red), between 1 kb and 10 kb (green), and between 10 kb and 50 kb (blue) from the original best-associated editing site. (d–g) Example of an RNA editing QTL in the CROL gene. Predicted local RNA secondary structure for the (d) G and (e) A alleles. Two editing sites influenced by the edQTL are shaded in red (numbered 1 and 2) and the edQTL is shaded in green. Relationship between editing levels and strain genotypes for the edQTL at the two associated editing sites (linear model), (f) chr2L:11796345 (site 1) and (g) chr2L:11796346 (site 2).

