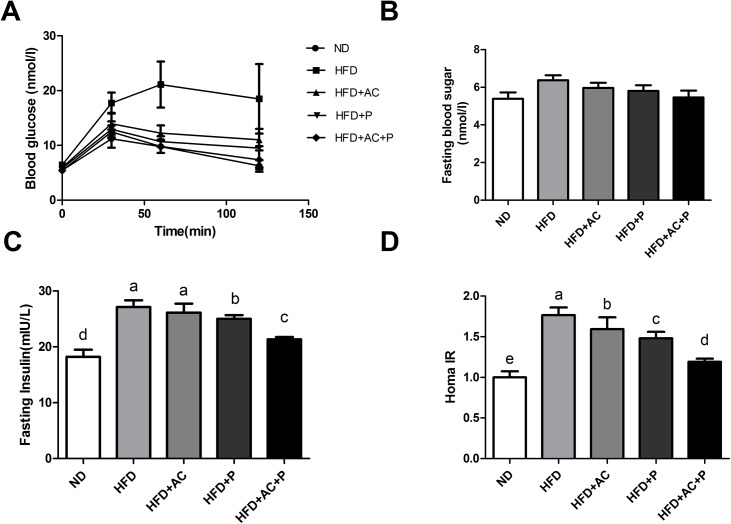
Fig 1. Probiotics combined with AC ameliorated blood glucose levels and IR.
(A) Intraperitoneal glucose tolerance test. (B) Fasting blood glucose levels. (C) Fasting plasma insulin levels, and (D) HOMA-IR were assessed. The data are shown as mean±SD, n = 6. Means within a row with different superscript letters are significantly different (P<0.05).

