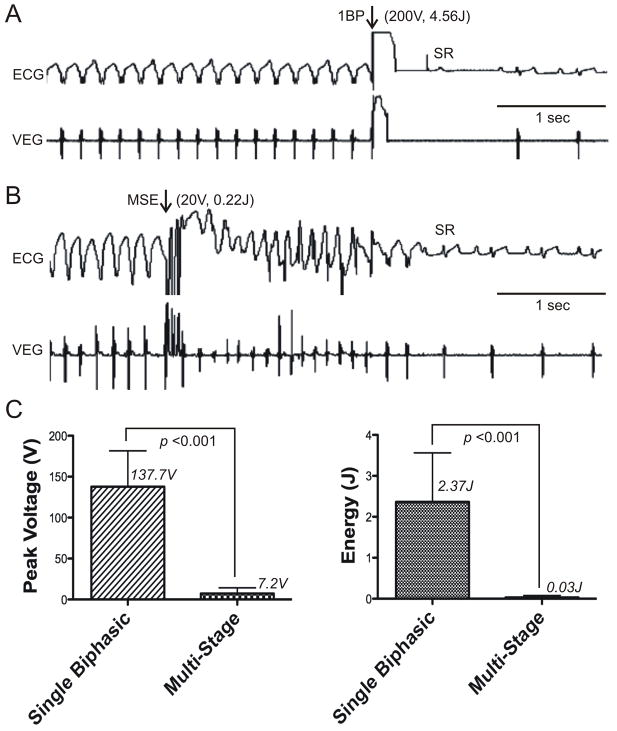
Figure 4. Sample Terminations and Mean Defibrillation Thresholds of a Single Biphasic Shock versus Multi-Stage Electrotherapy.
A: Surface ECG and ventricular electrogram (VEG) of a termination of monomorphic VT by a single biphasic shock with peak leading edge voltage of 200 V (4.56 J). Arrows indicate the time of electrotherapy application. B: Surface ECG and VEG of a terminations of monomorphic VT by Multi-Stage Electrotherapy (MSE) with peak voltage of 20 V (0.22 J). C: Mean DFTs of a single biphasic shock (Single Biphasic) and MSE (Multi-Stage) are shown with respect to peak voltage (left panel) and total energy (right panel). 1BP, single biphasic shock; MSE, multi-stage electrotherapy; SR: sinus rhythm.

