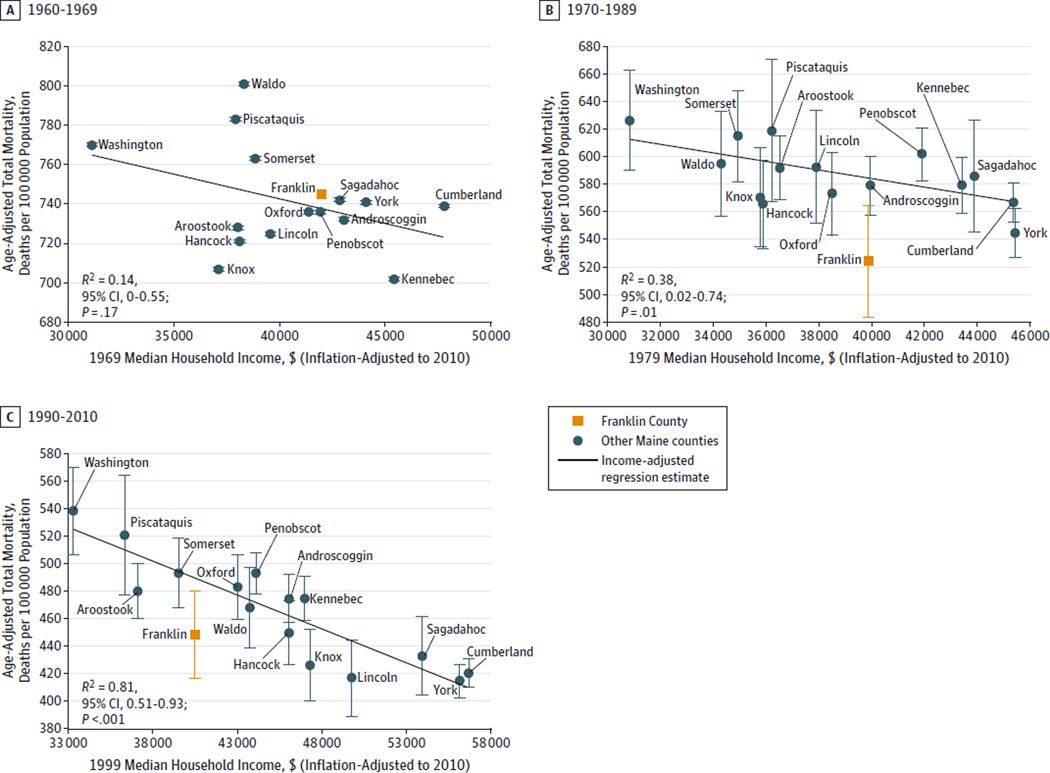
Figure 5. Age-Adjusted Total Mortality Rates vs Household Income for 3 Time Periods: 1960–1969, 1970–1989, and 1990–2010.
Maine county age-adjusted mortality rates vs income over 3 time periods. Error bars indicate non–income-adjusted 95% confidence intervals. County death data were not available for 1960–1969 to calculate confidence intervals. Regression was performed on Maine county-level data excluding Franklin County. Franklin County external t test values: 1960–1969: 0.27 (P = .36); 1970–1989: 3.15 (P < .001); 1990–2010:2.28 (P = .005). The observed − expected mortality in Franklin County for each period: 1960–1969: 7.9 deaths/100 000 (95% CI, −22.0 to 37.9); 1970–1989: −60.4 deaths/100 000 (95% CI, −97.9 to −22.8); 1990–2010: −41.6 deaths/100 000 (95% CI, −77.3 to −5.8).

