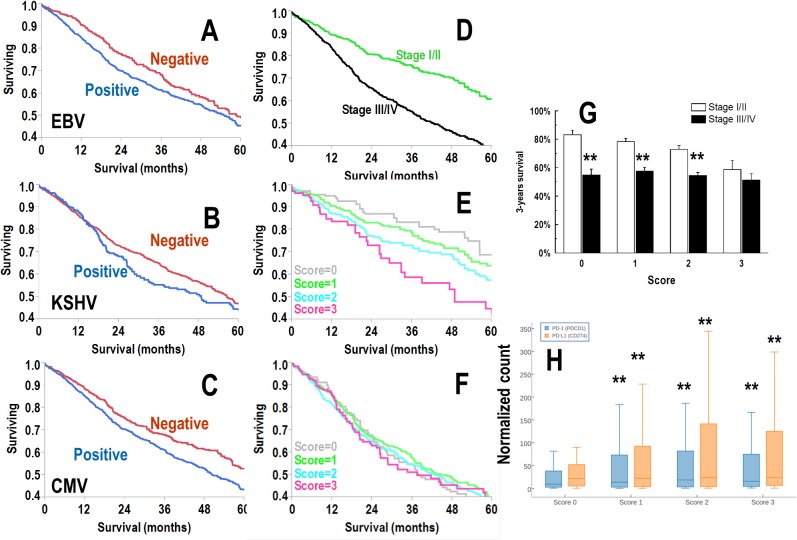
Fig 3.
A-C: Kaplan-Meier analysis for the expression of viral miRNA expression (A, B and C for EBV, KSHV and CMV, respectively). Patients were categorized as positive or negative if the TPM sum was >0 or 0, respectively. D: Kaplan-Meier analysis according to tumor stage. In green and black are AJCC stage I/II and stage III/IV, respectively (p<0.001). E&F: Kaplan-Meier analysis according to a cumulative score for no expression (score 0) or expression of one, two or three viruses such as EBV, KSHV and HSV-2. Score 3 indicates the expression of viral miRNA from all the three viruses. In gray, green, light blue and magenta are scores 0, 1, 2 and 3, respectively. In E, the chart refers to early AJCC stage (I/II), while F shows late AJCC stage (stage III/IV). Differences across the four groups is significant (p<0.001) only in E. G: Bar chart showing the three years survival in patients according to the viral score. Bar and error bars are probability of survival at 3-years and its standard deviation, respectively. Double asterisks indicate a significant difference (t-test, p<0.05). Early diagnosis is not protective with score 3 patients exhibiting not significant differences in terms of 3-years survival H: Box-whisker plot showing the expression of PD-1 (PDCD1) and PD-L1 (CD274) according to viral score Box and whisker represent the 25th-75th percentile range and the 5th-95th percentile range, respectively. Horizontal line in the plot is the median. Double asterisks indicate a significant difference as compared with score 0 (Tukey test, p<0.001).

