
Figure 1.
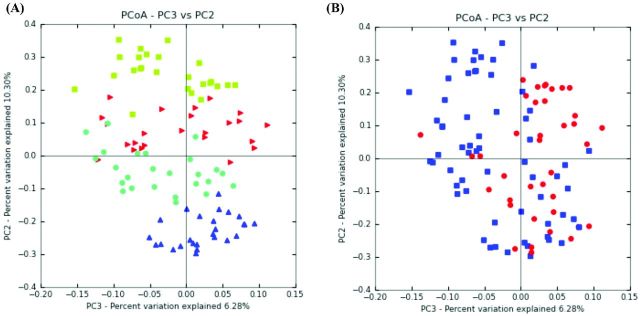
(A) PCoA plot of samples from both time points. Green squares (Cellulose), red triangles (Black bran), light blue circles (Hi Tannin black bran) and blue triangles (Sumac bran) illustrate differences in rat fecal bacterial populations due to experimental diets. (B) PCoA plot of amples post DSS#2 and DSS#3. Blue squares (post DSS#3) and red circles (post DSS#2) illustrate differences in rat fecal bacterial populations following DSS treatment over time.