
Figure 2.
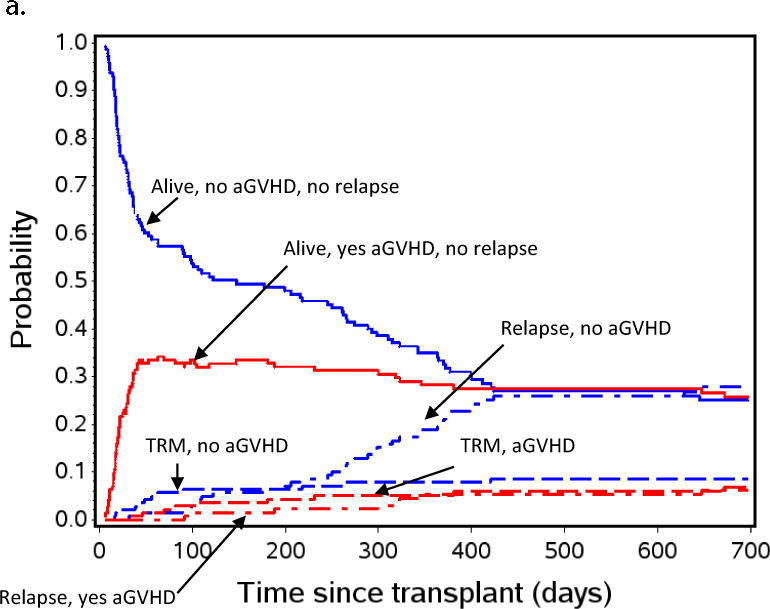
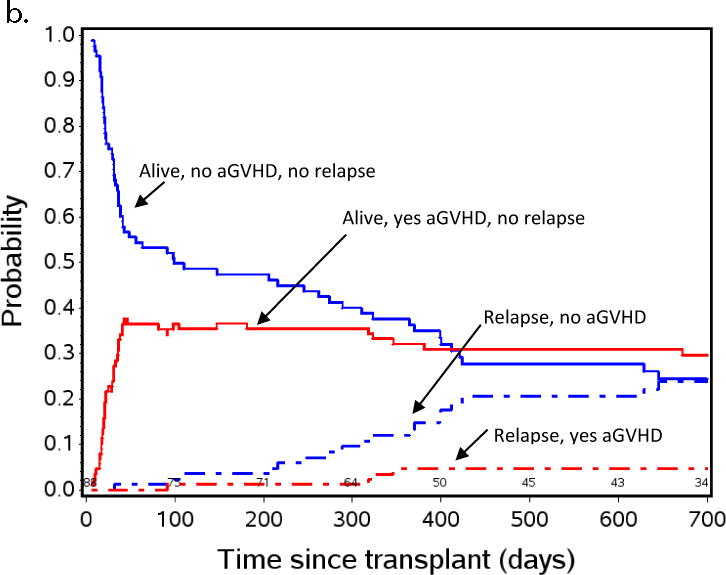
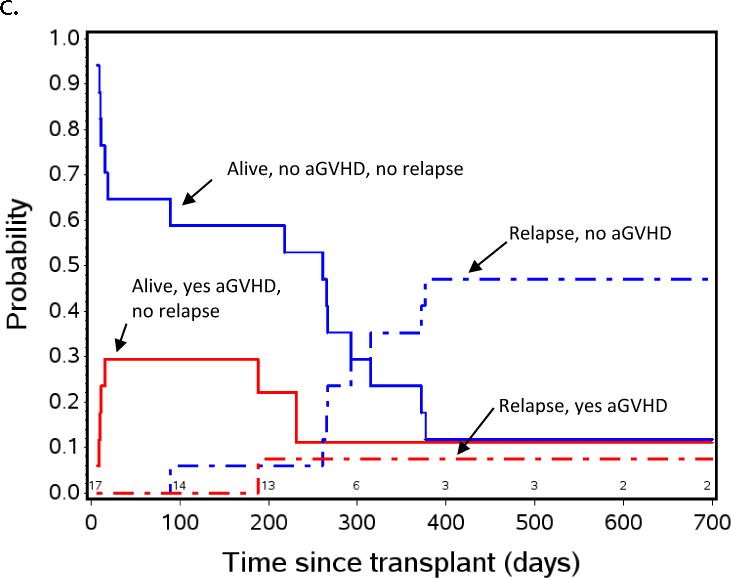
Aalen-Johansen non-parametric patient state probabilities: a) all patients (N=143) are represented through day +700 after HCT. b) patients with low or absent MRD pre-HCT, and c) patients with pre-HCT MRD≥ 0.1% measured by flow cytometry in BM within 2 weeks initiating their preparative regimen. Red and blue lines indicate patients who did (red) or did not (blue) experience aGVHD by day +55. Solid red and blue lines show patients with relapse-free survival, dashed lines represent TRM, dot-dash lines represent relapse. Because TRM was noted to be low in the overall population represented in Figure 2a, patients, this curve was not included in Figures 2b and 2c to emphasize the effect of aGVHD on relapse.