
Fig. 2.
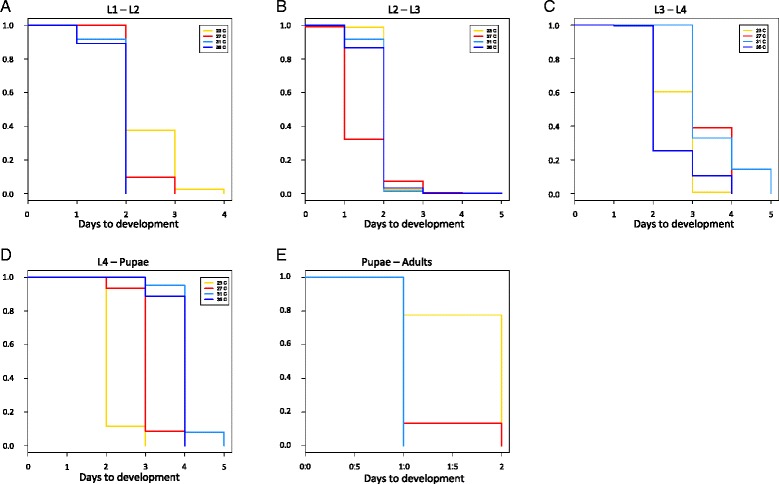
Kaplan-Meier plots of the stage-specific survival analysis of development times. a Development time from L1 to L2 larvae. b Development time from L2 to L3 larvae. c Development time from L3 to L4 larvae. d Development time from L4 larvae to pupae. e Development time from pupae to adults. Coloured lines represent the environmental temperatures investigated as described in Fig. 1