
Fig. 3.
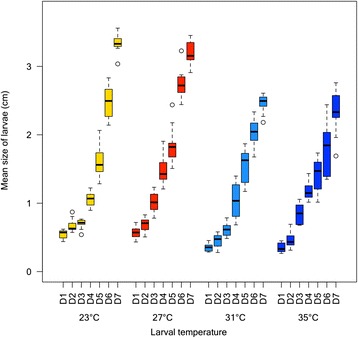
Mean larval size by day as a function of environmental temperature. Size of larvae (in cm) by day post-hatching (D1 is 24 h post-hatching, D2 48 h post-hatching, etc.) and by temperature (23 ± 1 °C: yellow; 27 ± 1 °C: red; 31 ± 1 °C: light blue; 35 ± 1 °C: dark blue). The bottom and top of the boxes describe the first and third quartiles respectively, and the bold line inside the boxes represents the median. The whiskers show the data minima and maxima, and the small circles represent outliers