
Fig. 4.
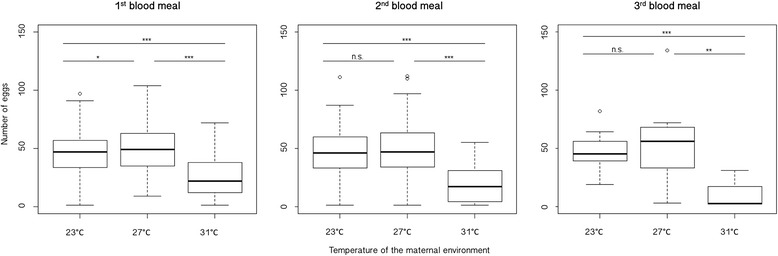
Number of eggs laid at each adult temperature after each blood meal. The bottom and top of the boxes describe the first and third quartiles respectively, and the bold line inside the boxes represents the median. The whiskers show the data minima and maxima, and the small circles represent outliers. (n.s.: not significant; *: p < 0.05; **: p < 0.01; ***: p < 0.001)