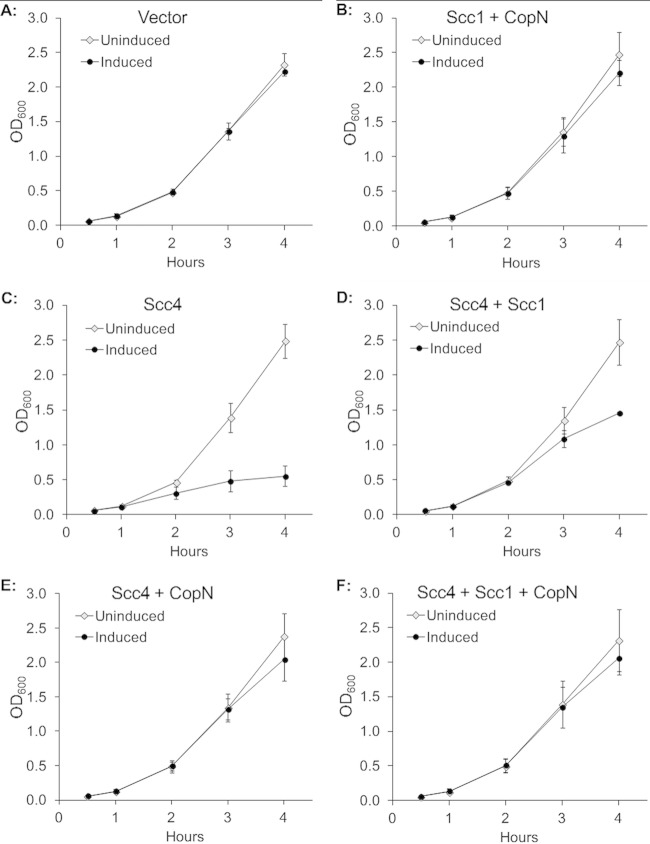
FIG 3.
Effect of C. trachomatis Scc4, Scc1, and CopN in various combinations on E. coli growth as measured by OD600. Each graph shows the growth curve in the absence (uninduced) or presence (induced) of IPTG. The x axis shows the time after the addition of 0.1 mM IPTG to the induced sample. (A) Empty vector plasmid; (B) Scc1 and CopN; (C) Scc4 alone; (D) Scc4 and Scc1; (E) Scc4 and CopN; (F) Scc4, Scc1, and CopN.

