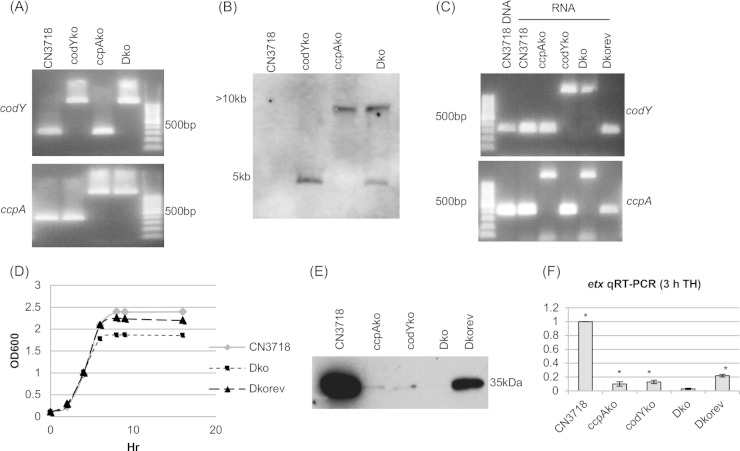
FIG 7.
ccpA and codY double null mutant strain preparation and characterization. (A) PCR confirmation of the construction of an isogenic ccpA, codY, or double null mutant strain. The same PCR assay amplified a larger product for the null mutant strain. The top blot shows the codY PCR product amplified using DNA from wild-type strain CN3718, codYko, ccpAko, or Dko. Only the DNA from strain codYko and strain Dko amplified a larger band. The bottom blot shows the ccpA PCR product amplified from the same strains, with both ccpAko and Dko DNA supporting amplification of a larger band. The rightmost, unlabeled lane contains a 100-bp molecular ruler. (B) Intron-specific Southern blot hybridization with DNA from wild-type CN3718, ccpAko, codYko, or Dko strain. DNA from each strain was digested with EcoRI and electrophoresed on a 1% agarose gel. The sizes of DNA fragment are shown to the left. In wild-type CN3718, no intron-specific band was detected. One intron-specific band was detected for the codY or ccpA single null mutant strains, and two bands were detected for the Dko strain. (C) RT-PCR analysis for codY (top) or ccpA (bottom) transcription of CN3718, ccpAko, codYko, Dko, and Dkorev strains. The leftmost, unlabeled lane contains a100-bp molecular ruler. The lane labeled CN3718 DNA shows the PCR product of chromosomal DNA using the same primers as for the RT-PCR. (D) Postinoculation changes in optical density (OD600) for cultures of wild-type strain CN3718, Dko strain, and the reversed complementing strain Dkorev when grown in TH medium at 30°C. (E) ETX Western blot analysis of CN3718, ccpAko, codYko, Dko, and Dkorev strains in TH medium cultured overnight at 30°C. (F) Quantitative RT-PCR analyses of etx transcription in 3-h TH culture of CN3718, ccpAko, codYko, Dko, and Dkorev strains. Average CT values were normalized to the housekeeping 16S RNA gene, and the fold differences were calculated using the comparative CT method (2−ΔΔCT). Each bar indicates the calculated fold change relative to wild-type CN3718. All experiments were repeated three times, and mean values are shown. The error bars indicate standard deviations. *, P < 0.005 compared to wild-type strain by ordinary one-way ANOVA.

