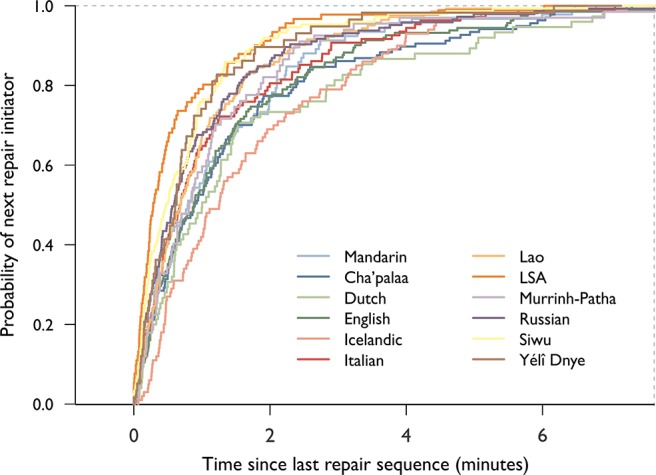
Fig 2. The frequency of repair.

Empirical density curve showing the proportion of independent repair initiations encountered after a given amount of time has elapsed since the last one. The vast majority of repair initiations happen within 5 minutes of each other.
