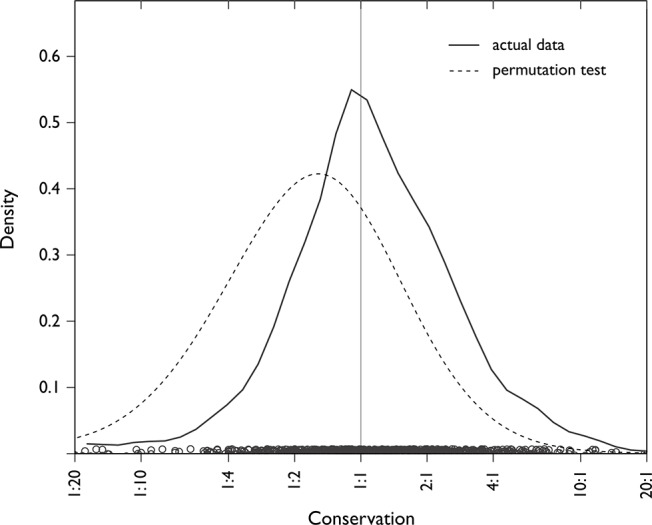
Fig 4. Conservation principle.

Density plot of actual conservation ratios of each case in the data set (black line), with an average near 1:1; and of conservation ratios from a permutation test using randomly chosen trouble source turns (grey line), with an average of 1:1.7, closer to a null hypothesis for conservation (simulation and further explanation in S4 Text). On average, the length of the two-turn repair sequence matches the length of the trouble source turn.
