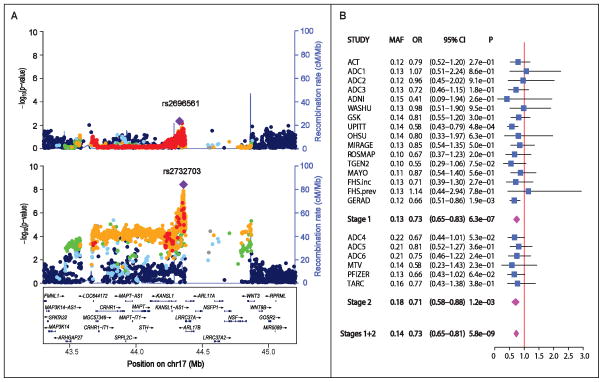
Figure 1.
Association of AD with SNPs in chromosome 17q21.31 in the combined stage 1 and stage 2 samples. (A) Regional Manhattan plot in the APOE ε4+ (upper panel) and the APOE ε4− (lower panel) subgroups. SNPs with the lowest P-value are indicated with a purple diamond. Computed estimates of linkage disequilibrium (r2) of SNPs in this region with the most significant SNP are shown as red circles for r2 ≥ 0.8, orange circles for 0.6 ≤ r2 < 0.8, green circles for 0.4 ≤ r2 < 0.6, light blue circles for 0.2 ≤ r2 < 0.4, and blue circles for r2 < 0.2. Unannotated SNPs are shown as grey circles. (B) Forest plot of association results for rs2732703 in the Stage 1, Stage 2 and total samples among APOE ε4− subjects.

