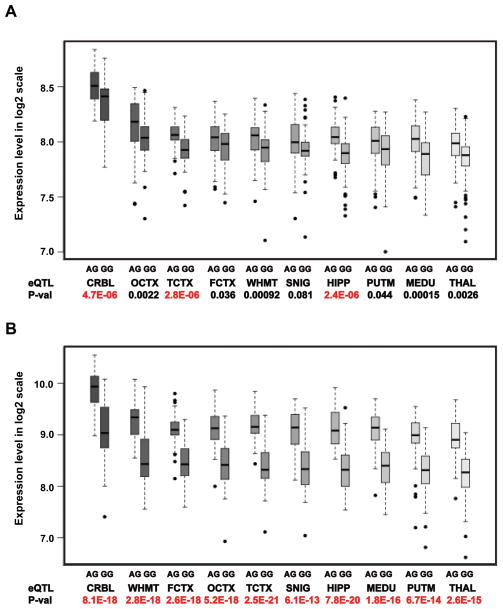
Figure 2.
Genotype specific effect of the eQTL rs113986870 on expression of KANSL1. (A) Gene-level expression of KANSL1 transcript t3760137. Transcript-level expression represents the average across all KANSL1 exon probe sets. (B) Expression of exon probe 3760212. Probes 3760211, 3760212, and 3760213 measure expression of the first translated exon, are present in all three transcript variants, and were significantly associated with the eQTL. Expression profiles for probes 3760211 and 3760213 showed similar to those for probe 3760212 (Table 3). The distance from 3760212 to rs113986870 is 85,431 base pairs. Log2 scale of expression (Y-axis) is shown for 10 regions of cognitively normal human brains (X-axis) ordered by mean expression level. Rs113986870 genotype counts: AA=0, AG=56, and GG=76. Rs113986870 allele frequencies are 0.21 (A) and 0.79 (G). CRBL = cerebellum, FCTX = frontal cortex, HIPP = hippocampus, MEDU = medulla (specifically inferior olivary nucleus), OCTX = occipital cortex (specifically primary visual cortex), PUTM = putamen, SNIG = substantia nigra (SNIG), THAL = thalamus, TCTX = temporal cortex), WHMT = intralobular white matter.

