
Figure 1.
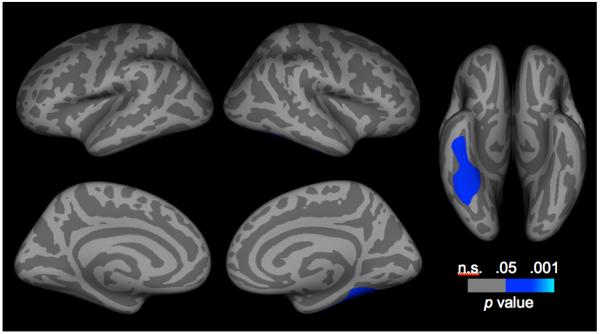
Corrected statistical significance maps showing areas of thinner cortical gray matter in girls at high versus low risk for depression. Statistical maps are shown on the inflated surface of the standard average participant, allowing visualization of data across the entire cortical surface without interference from cortical folding.