
Figure 3.
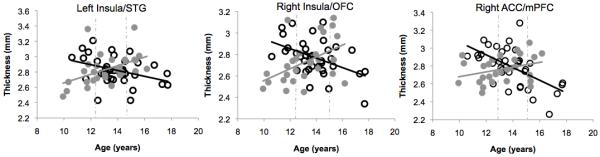
Scatter plots showing interactions of risk group and age for gray matter thickness in the right anterior cingulate cortex (ACC; left), the right insula (middle) and the left insula (right) for girls at high (gray circles) and low (black circles) risk for depression. Dotted lines indicate regions of significance (see text).