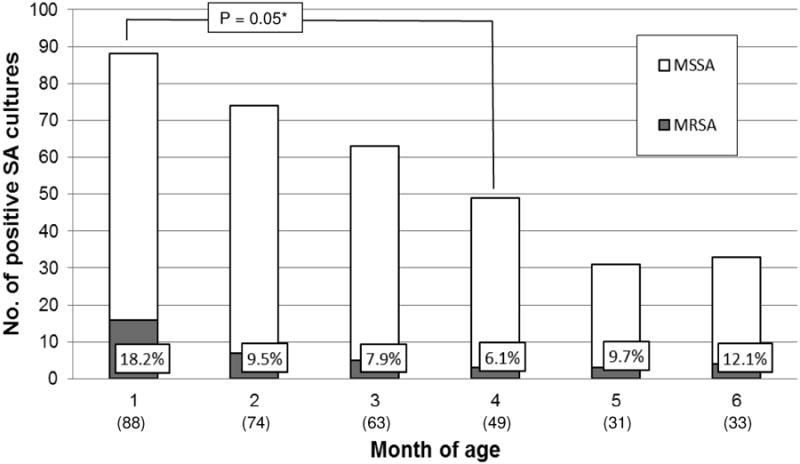
Fig 2. Nasopharyngeal colonization rates of MRSA and MSSA by month of age (n=367 infants).

SA = S. aureus, MRSA = methicillin-resistant SA, MSSA = methicillin-sensitive SA. Figures in parentheses are number of children who tested positive for SA at each month of age. Figures in boxes represent percentage of MRSA of the total positive SA cultures. *P value were calculated by Chi-Square test. Not all infants had nasopharyngeal bacterial cultures done at each monthly interval.
