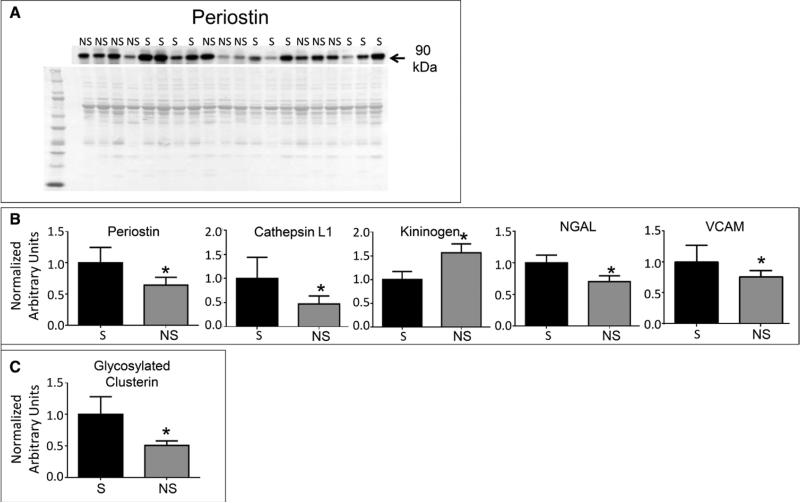
Figure 3.
Validation of glycopeptide and protein expression by immunoblotting. A, Representative immunoblot of periostin. B, Graphs representing densitometric units normalized to the total protein stain of the entire lane represent protein levels of periostin, cathepsin-L1, vascular cell adhesion molecule (VCAM), neutrophil gelatinase–associated lipocalin (NGAL), and kininogen, measured by immunoblotting. C, Immunoblotting for clusterin, isolated using lectin precipitation, revealed that densitometric units of glycosylated clusterin normalized to the total protein stain of the entire lane were decreased in nonsurvivors (NS) (n = 4) compared with survivors (S) (n = 4). Data are represented as mean ± sem.

