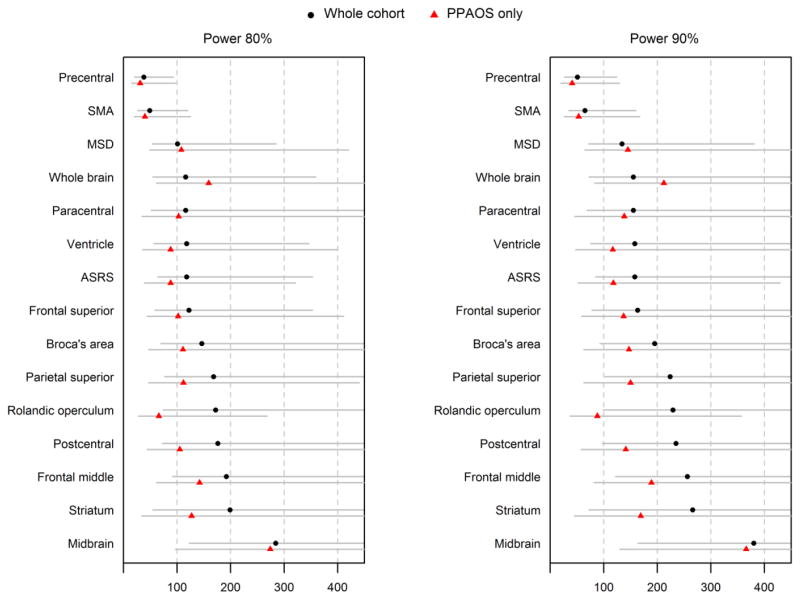
Figure 3.
Forest plots illustrating sample size estimates and 95% bootstrap confidence intervals for all neuroimaging and clinical outcome measures. Sample size estimates are given for both the whole progressive apraxia of speech cohort and the PPAOS subset, at 80% and 90% power. The 95% CIs are shown to account for uncertainty in the means and SDs used in the sample size formulas. SMA = supplementary motor area; ASRS = Apraxia of Speech Rating Scale; MSD = Motor Speech Disorders scale.

