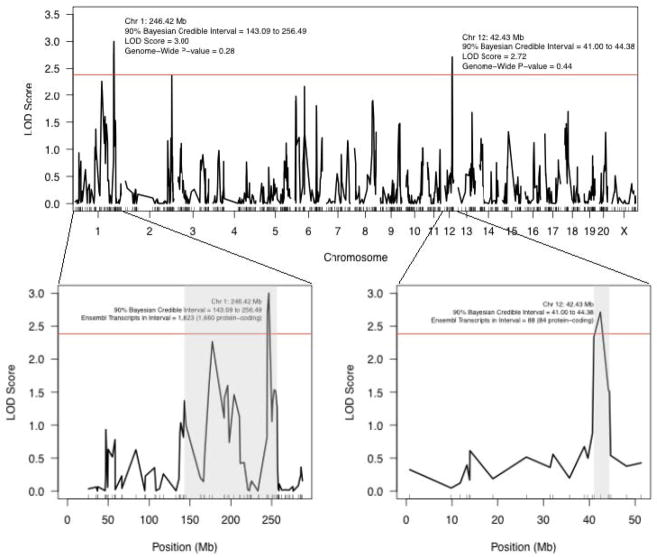
Figure 2. LOD profile of voluntary alcohol consumption in the HXB/BXH recombinant inbred panel.
Strain means were used in a marker regression to determine behavioral QTL for voluntary alcohol consumption in the 2-bottle 24-hour access paradigm. Two suggestive (p<0.63) QTL are labels with their location, credible interval, LOD score, and genome-wide p-value. The red line represents the LOD threshold for a suggestive p-value (2.38, genome-wide p-value=0.63). The two insets are more detailed views of the 2 suggestive peaks. Their 90% Bayesian credible intervals are shaded grey. The QTLs are labeled with their location, credible interval, and the number of Ensembl transcripts and Ensembl protein-coding transcripts physically located within each QTL's credible interval.

