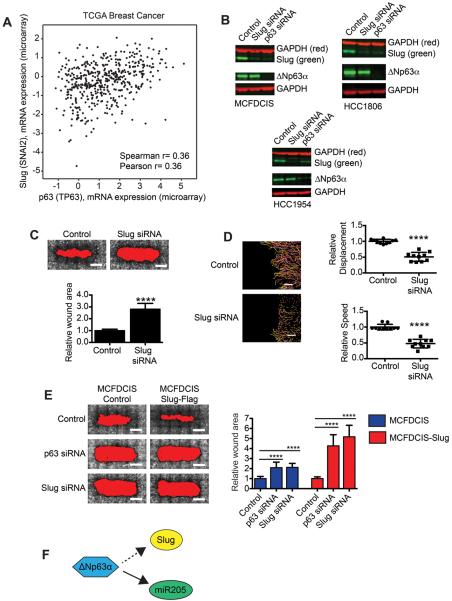
Figure 3. ΔNp63α promotes cell motility by regulating Slug expression.
(A) Graph showing expression of p63 (x) and Slug (y) in breast tumors. (B) Immunoblots showing expression of Slug and ΔNp63α in cell lines transfected as indicated (n=2). (C) Wound healing of MCFDCIS cells transfected as indicated. Scale bars, 1 mm. Graph shows relative wound area (mean + SD, n=6 wounds from 2 independent experiments). ****p< 0.0001, unpaired Student's t-test. (D) MCFDCIS cells transfected as indicated were wounded and imaged for 7 h. Scale bars, 100 μm. Graphs show cell speed and displacement (mean ± SD, n=10 x,y positions over 2 independent experiments). ****p< 0.0001, unpaired Student's t-test. (E) Wound healing of MCFDCIS and MCFDCIS-Slug cells transfected as indicated. Scale bars, 1 mm. Graph shows quantification of wound area (mean + SD, n=9 wounds from 3 independent experiments). ****p< 0.0001, unpaired Student's t-test. (F) Graphic showing ΔNp63α regulation of Slug and miR205.

