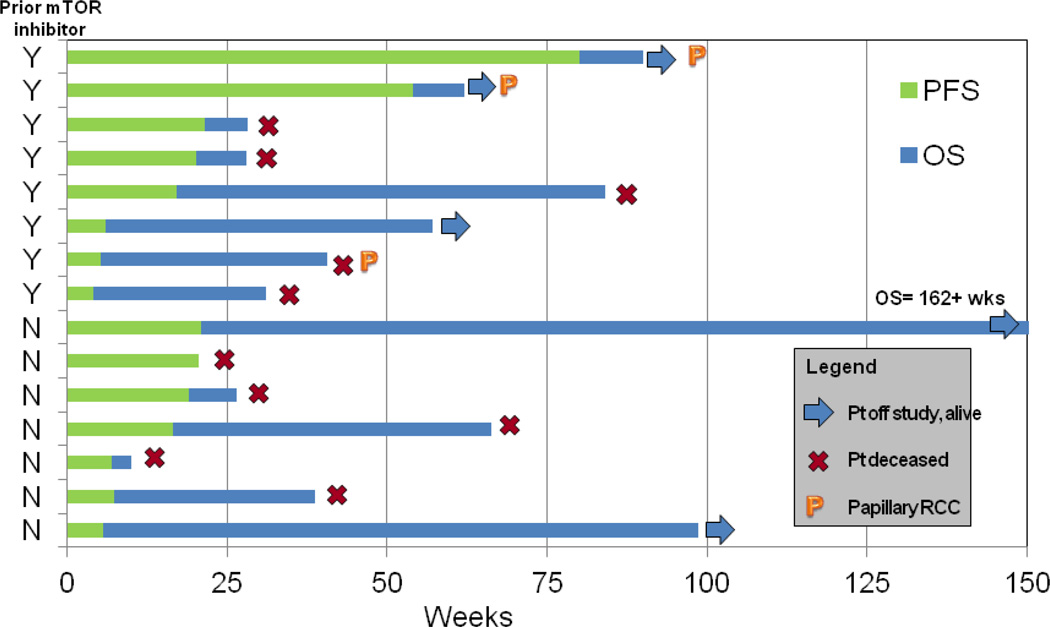
Figure 4. Swimmer’s Plot of Progression Free and Overall Survival.
Chart depicts progression free and overall survival of each individual patient as a function of time as measured in weeks. Patients are divided with those having received a prior mTOR inhibitor on the top and those without prior mTOR inhibition towards the bottom. Symbols indicate whether patients were still living at the time of data cut-off; no patients remained on study.
Note: mTOR, mammalian target of rapamycin; PFS, progression free survival; OS, overall survival; Wks, weeks

