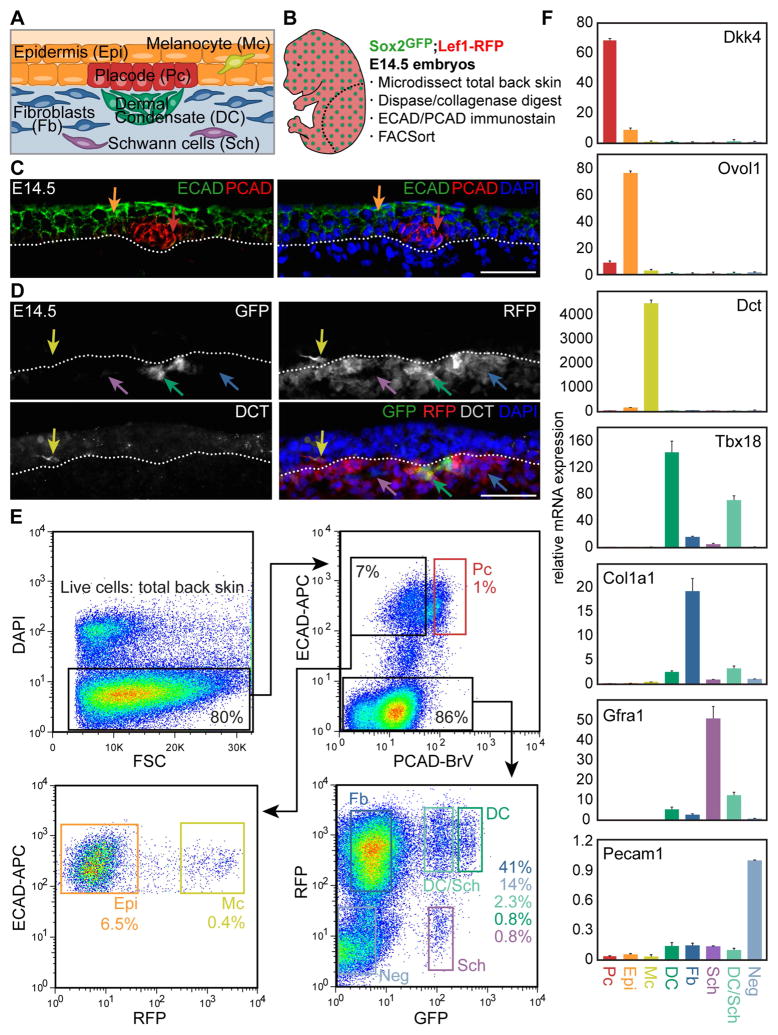
Figure 1. Multicolor cell sorting of embryonic hair follicle progenitors, niche and key skin cell populations.
(A) Schematic of embryonic day (E)14.5 skin with early stage hair follicle.
(B) Outline of cell sorting strategy from E14.5 Sox2GFP/Lef1-RFP double-transgenic skin. Diagram illustrates the back skin area microdissected for analysis.
(C) Immunofluorescence staining for E-cadherin (ECAD) marks all epithelial cells (Epi, orange arrow) and P-cadherin (PCAD) is highest in placode cells (Pc, red arrow). Dotted line demarcates basement membrane. DAPI highlights all nuclei.
(D) Sox2GFP/Lef1-RFP E14.5 back skin includes GFP+/RFP+ dermal condensate cells (DC, green arrow), GFP−RFP+ dermal fibroblasts (Fb, blue arrow), GFPlowRFP− Schwann cells (Sch, purple arrow); immunofluorescence for DCT confirms RFP+ cells in the epidermis are melanocytes (Mc, yellow arrow).
(E) FACS plots and gates for cell sorting. Starting from live cells, 8 distinct gates mark HF progenitors, niche cells, 4 other specific cell types and 2 mixed cell populations inclusive of the entire embryonic back skin.
(F) qRT-PCR for known marker genes demonstrates high enrichment for each purely isolated cell type. Data are mean ± SD from 2 measurements.
Scale bars are 50 μm in C, D. See also Figure S1.

