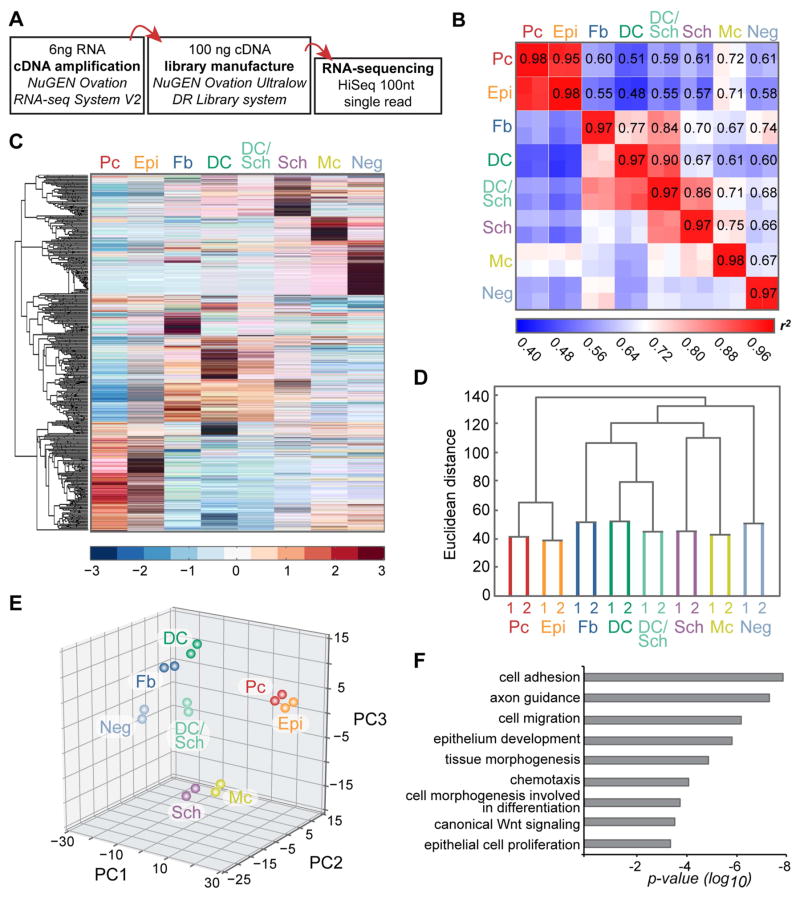
Figure 2. Cell population-level analyses of RNA-sequencing data from embryonic skin cell types.
(A) Workflow of sample preparation for RNA-sequencing.
(B) Heat map of coefficient of determination (r2) for gene expression profiles of all isolated cell populations.
(C) Hierarchical clustering of differentially expressed genes. Heat map illustrates distinct clusters of enriched gene expression in all isolated embryonic skin cell types.
(D) Hierarchical clustering analysis of embryonic skin cell populations. Biological replicates cluster together. Epithelial, mesenchymal and neural crest-derived cells group separately. Y-axis, Euclidean distance.
(E) Principal component analysis with PC1 (43.74% variance captured); PC2 (16.97% variance captured); PC3 (15.81% variance captured).
(F) Gene ontology analysis for differentially expressed genes. Shown are significantly overrepresented functional categories in embryonic skin.

