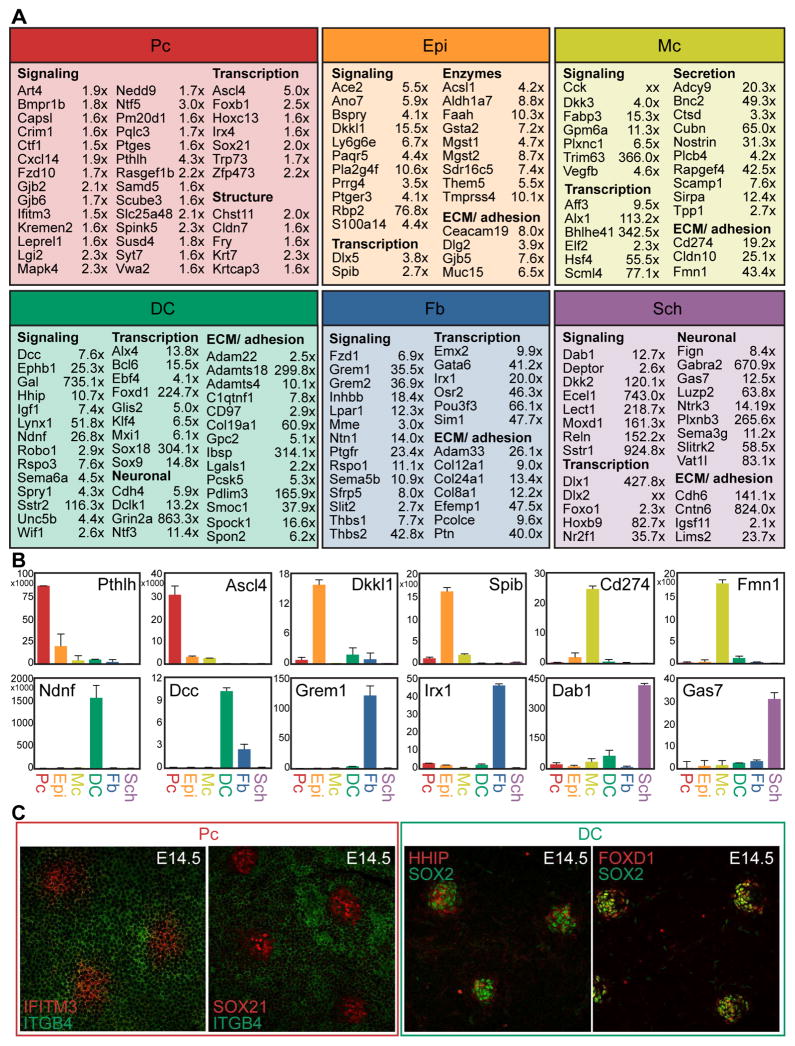
Figure 5. Cell type-specific RNA-sequencing reveals many new signature genes.
(A) Select enriched genes for each cell type are listed along with the fold change of gene expression as measured by FPKM. Fold change is measured as Pc vs. Epi, DC vs. Fb, Sch vs. Mc. Genes are organized according to functional categorization. FDR of q<0.05 for all genes.
(B) qRT-PCR verification of select signature genes for each cell type. Data are mean ± SD from 2 measurements. See also Figure S3.
(C) Immunofluorescence staining verification of selected signature genes for the Pc and DC. Whole-mount view of E14.5 skin. See also Figure S3.

